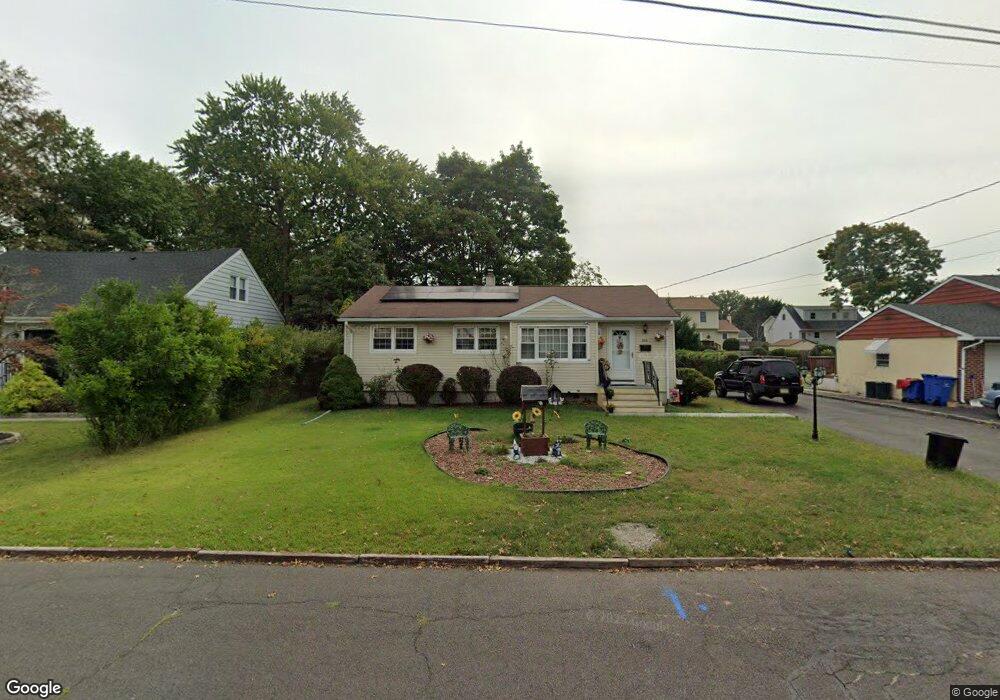
560 Cook Ave Middlesex, NJ 08846
Estimated Value: $455,000 - $503,000
3
Beds
2
Baths
1,050
Sq Ft
$457/Sq Ft
Est. Value
About This Home
This home is located at 560 Cook Ave, Middlesex, NJ 08846 and is currently estimated at $480,085, approximately $457 per square foot. 560 Cook Ave is a home located in Middlesex County with nearby schools including Middlesex High School and Our Lady of Mount Virgin School.
Ownership History
Date
Name
Owned For
Owner Type
Purchase Details
Closed on
Aug 16, 2005
Sold by
Nguyen Jacqueline
Bought by
Miranda Eduardo
Current Estimated Value
Home Financials for this Owner
Home Financials are based on the most recent Mortgage that was taken out on this home.
Original Mortgage
$310,000
Outstanding Balance
$165,559
Interest Rate
5.92%
Estimated Equity
$314,526
Purchase Details
Closed on
May 11, 2005
Sold by
Wincek Marion
Bought by
Nguyen Jacqueline
Create a Home Valuation Report for This Property
The Home Valuation Report is an in-depth analysis detailing your home's value as well as a comparison with similar homes in the area
Home Values in the Area
Average Home Value in this Area
Purchase History
| Date | Buyer | Sale Price | Title Company |
|---|---|---|---|
| Miranda Eduardo | $387,500 | -- | |
| Nguyen Jacqueline | $275,000 | -- |
Source: Public Records
Mortgage History
| Date | Status | Borrower | Loan Amount |
|---|---|---|---|
| Open | Miranda Eduardo | $310,000 |
Source: Public Records
Tax History
| Year | Tax Paid | Tax Assessment Tax Assessment Total Assessment is a certain percentage of the fair market value that is determined by local assessors to be the total taxable value of land and additions on the property. | Land | Improvement |
|---|---|---|---|---|
| 2025 | $8,506 | $441,700 | $143,800 | $297,900 |
| 2024 | $8,098 | $367,600 | $143,800 | $223,800 |
Source: Public Records
Map
Nearby Homes
- 562 Cook Ave
- 550 Cook Ave
- 575 W Pershing Ave
- 579 W Pershing Ave
- 546 Cook Ave
- 547 Cook Ave
- 587 Cook Ave
- 571 W Pershing Ave
- 540 Cook Ave
- 548 Howard Ave
- 589 Cook Ave
- 567 W Pershing Ave
- 544 Howard Ave
- 9 Gulfstream Blvd
- 34 Vernon St
- 66 Cottonwood Ct
- 541 Giles Ave
- 536 Cook Ave
- 563 W Pershing Ave
- 537 Cook Ave
Your Personal Tour Guide
Ask me questions while you tour the home.