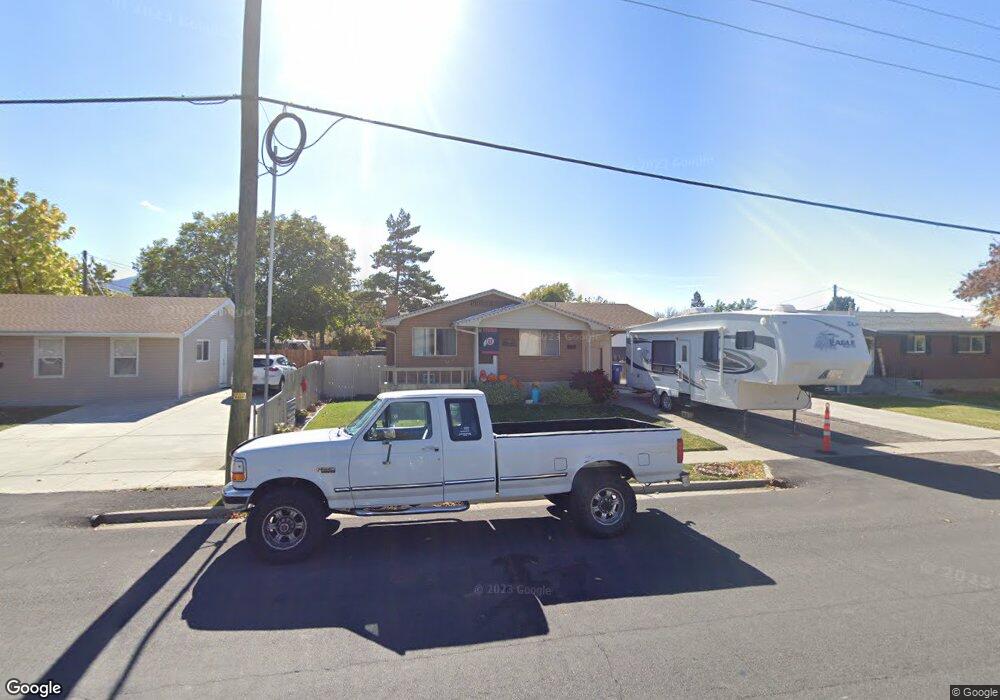
560 E 900 N Spanish Fork, UT 84660
Estimated Value: $450,000 - $494,000
4
Beds
2
Baths
1,092
Sq Ft
$428/Sq Ft
Est. Value
About This Home
This home is located at 560 E 900 N, Spanish Fork, UT 84660 and is currently estimated at $467,842, approximately $428 per square foot. 560 E 900 N is a home located in Utah County with nearby schools including Park Elementary School, Spanish Fork Jr High School, and Spanish Fork High School.
Ownership History
Date
Name
Owned For
Owner Type
Purchase Details
Closed on
Jan 8, 2010
Sold by
Smith Debbie L and Herbert Debbie
Bought by
Smith Debbie L
Current Estimated Value
Home Financials for this Owner
Home Financials are based on the most recent Mortgage that was taken out on this home.
Original Mortgage
$111,000
Outstanding Balance
$72,209
Interest Rate
4.77%
Mortgage Type
New Conventional
Estimated Equity
$395,633
Purchase Details
Closed on
Sep 16, 1999
Sold by
Johnson Gary Shelton
Bought by
Johnson Clayton Jeff and Johnson Julie
Home Financials for this Owner
Home Financials are based on the most recent Mortgage that was taken out on this home.
Original Mortgage
$60,000
Interest Rate
8.09%
Purchase Details
Closed on
May 18, 1999
Sold by
Herbert Quinn B and Herbert Debbie L
Bought by
Herbert Debbie
Home Financials for this Owner
Home Financials are based on the most recent Mortgage that was taken out on this home.
Original Mortgage
$101,000
Interest Rate
6.92%
Create a Home Valuation Report for This Property
The Home Valuation Report is an in-depth analysis detailing your home's value as well as a comparison with similar homes in the area
Home Values in the Area
Average Home Value in this Area
Purchase History
| Date | Buyer | Sale Price | Title Company |
|---|---|---|---|
| Smith Debbie L | -- | Title West Spanish Fork | |
| Johnson Clayton Jeff | -- | Signature Title | |
| Herbert Debbie | -- | Associated Title Company |
Source: Public Records
Mortgage History
| Date | Status | Borrower | Loan Amount |
|---|---|---|---|
| Open | Smith Debbie L | $111,000 | |
| Closed | Johnson Clayton Jeff | $60,000 | |
| Previous Owner | Herbert Debbie | $101,000 |
Source: Public Records
Tax History
| Year | Tax Paid | Tax Assessment Tax Assessment Total Assessment is a certain percentage of the fair market value that is determined by local assessors to be the total taxable value of land and additions on the property. | Land | Improvement |
|---|---|---|---|---|
| 2025 | $2,129 | $252,505 | -- | -- |
| 2024 | $2,129 | $219,395 | $0 | $0 |
| 2023 | $2,131 | $219,945 | $0 | $0 |
| 2022 | $2,260 | $228,745 | $0 | $0 |
| 2021 | $2,051 | $332,100 | $89,300 | $242,800 |
| 2020 | $1,862 | $293,100 | $74,400 | $218,700 |
| 2019 | $1,598 | $264,600 | $74,400 | $190,200 |
| 2018 | $1,498 | $239,800 | $74,400 | $165,400 |
| 2017 | $1,314 | $113,025 | $0 | $0 |
| 2016 | $1,204 | $102,245 | $0 | $0 |
| 2015 | $1,145 | $96,085 | $0 | $0 |
| 2014 | $1,064 | $89,595 | $0 | $0 |
Source: Public Records
Map
Nearby Homes
Your Personal Tour Guide
Ask me questions while you tour the home.