
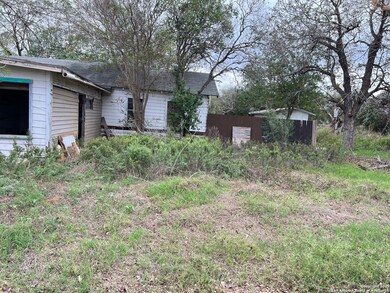
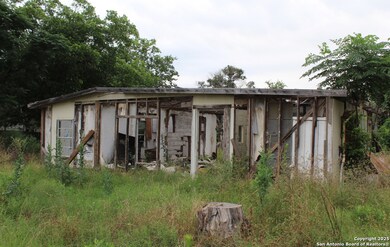
560 E Loop 1604 N San Antonio, TX 78264
Estimated payment $965/month
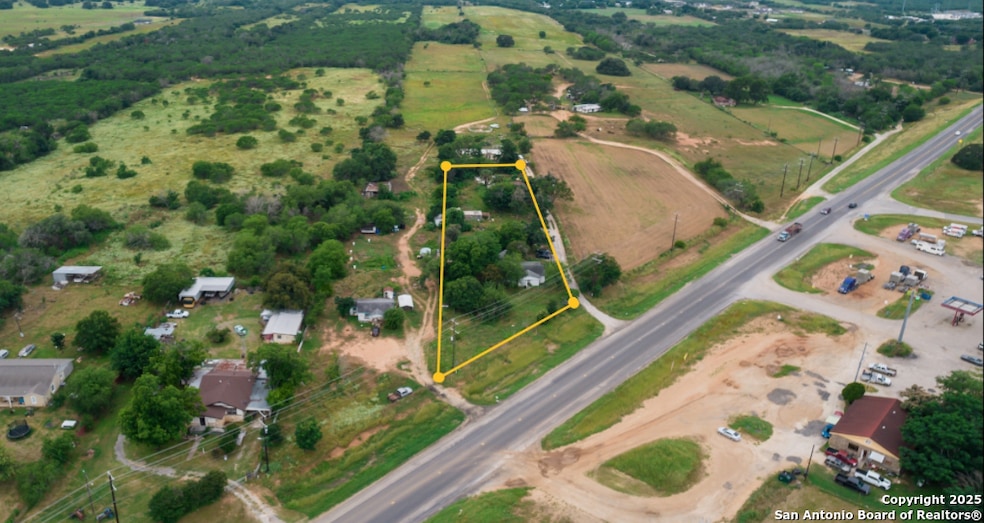
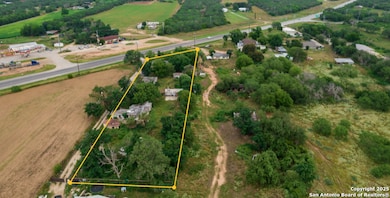
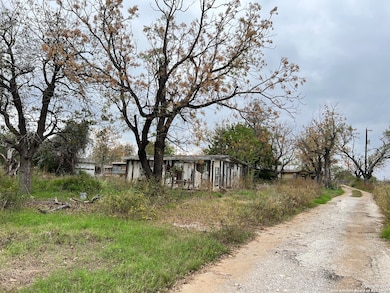
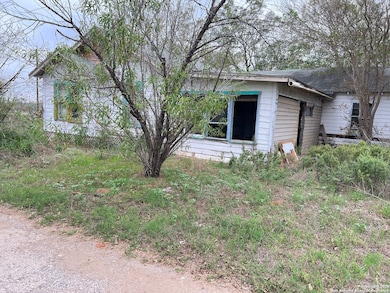
About This Lot
LOCATION! LOCATION! TWO LOTS FOR THE PRICE OF ONE!! 560 E. Loop 1604 & 560 S. Loop 1604 being sold together for a total of 1.2725 acres of UNRESTRICTED land. Zoned OCL - Great opportunity to build your dream home or start a business, park trucks allowed. No septic system or Water well required. We have confirmed through title search there NO RESTRICTIONS of record for this property. Seller has Survey too!
Listing Agent
Amanda Casanova
G Partners & Realty Listed on: 12/02/2025
Property Details
Property Type
- Land
Est. Annual Taxes
- $2,982
Lot Details
- 1.27 Acre Lot
- Property is zoned OCL
Home Design
- 2,681 Sq Ft Home
Schools
- Southside Elementary And Middle School
- Southside High School
Community Details
- Southside Rural So Subdivision
Listing and Financial Details
- Tax Lot MID
- Assessor Parcel Number 040122001013
Map
Property History
| Date | Event | Price | List to Sale | Price per Sq Ft |
|---|---|---|---|---|
| 01/30/2026 01/30/26 | Pending | -- | -- | -- |
| 12/02/2025 12/02/25 | For Sale | $135,000 | -- | $50 / Sq Ft |
Source: San Antonio Board of REALTORS®
MLS Number: 1926075
APN: 04012-200-1013
Disclaimer: Certain information contained herein is derived from information provided by parties other than Homes.com. All information provided is deemed reliable, but is not guaranteed to be accurate and should be independently verified.
![]() IDX information is provided exclusively for personal, non-commercial use, and may not be used for any purpose other than to identify prospective properties consumers may be interested in purchasing.
IDX information is provided exclusively for personal, non-commercial use, and may not be used for any purpose other than to identify prospective properties consumers may be interested in purchasing.
Information is deemed reliable but not guaranteed.
- 1804 E Loop 1604 N
- 9422 Braman Point
- 9416 Hagenbuch Hill
- 9157 Newcombe Dr
- 11432 Bamboo Dr
- 2017 Chicksaw Rose
- 11436 Bamboo Dr
- 11412 Bamboo Dr
- 11515 Cedar Close
- 12619 Azopardo
- 12614 Azopardo
- 11539 Cedar Close
- 11424 Bamboo Dr
- 9906 Mather Way
- 11906 Spiderwort Ridge
- 8047 Biggio Ln
- 11428 Bamboo Dr
- 10225 Green
- 7922 Biggio Ln
- 11453 Bamboo Dr