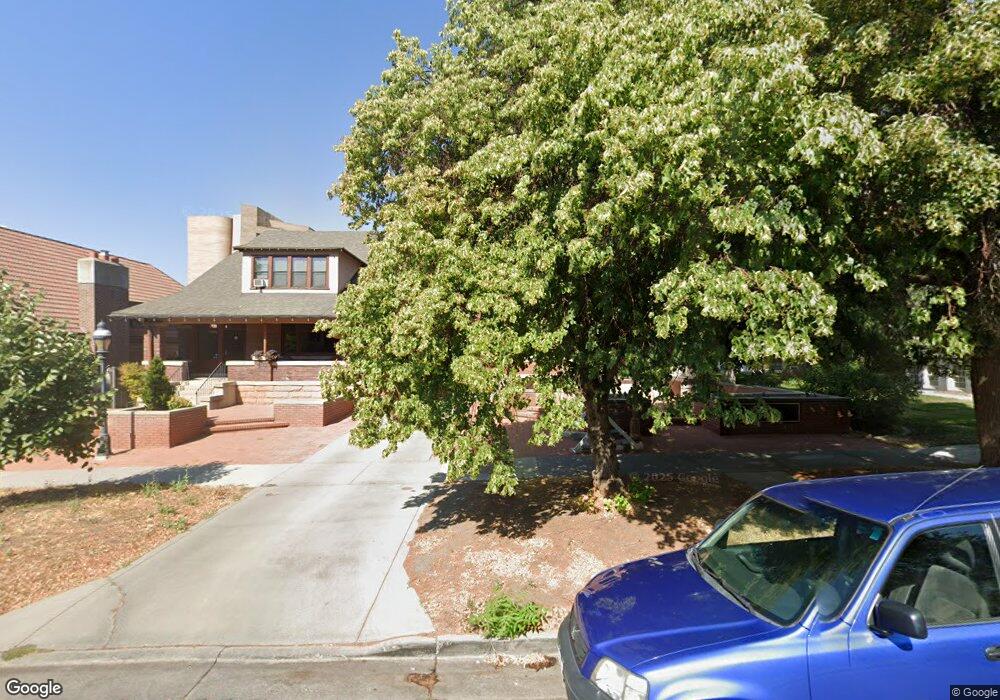
Governor's Plaza Condominium 560 E South Temple Unit 303 Salt Lake City, UT 84102
Central City NeighborhoodEstimated Value: $614,029 - $790,000
2
Beds
2
Baths
1,584
Sq Ft
$433/Sq Ft
Est. Value
About This Home
This home is located at 560 E South Temple Unit 303, Salt Lake City, UT 84102 and is currently estimated at $685,757, approximately $432 per square foot. 560 E South Temple Unit 303 is a home located in Salt Lake County with nearby schools including Wasatch Elementary School, East High School, and Open Classroom.
Ownership History
Date
Name
Owned For
Owner Type
Purchase Details
Closed on
Aug 26, 2022
Sold by
David M Diamond Revocable Living Trust
Bought by
Diamond Jason M
Current Estimated Value
Purchase Details
Closed on
Oct 27, 2011
Sold by
Mccleery Bradley Jeff
Bought by
Gaberino John A and Gaberino Jeffrey Diamond
Purchase Details
Closed on
Sep 22, 2004
Sold by
Filson Robert and Filson Mary
Bought by
Filson Robert P and Filson Mary L
Purchase Details
Closed on
Mar 10, 2004
Sold by
American Pension Services Fub
Bought by
Filson Robert and Filson Mary
Purchase Details
Closed on
Apr 8, 2003
Sold by
Icas Lc
Bought by
American Pension Services Fub and Maureen H Malcolm Roth Ira
Purchase Details
Closed on
Oct 18, 2002
Sold by
Bank Of Utah
Bought by
Icas Lc
Purchase Details
Closed on
Mar 31, 2000
Sold by
The Veloy H Butterfield Family Trust and Butterfield Veloy H
Bought by
Madsen Margaret
Create a Home Valuation Report for This Property
The Home Valuation Report is an in-depth analysis detailing your home's value as well as a comparison with similar homes in the area
Home Values in the Area
Average Home Value in this Area
Purchase History
| Date | Buyer | Sale Price | Title Company |
|---|---|---|---|
| Diamond Jason M | -- | -- | |
| Gaberino John A | -- | Backman Title Services | |
| Filson Robert P | -- | -- | |
| Filson Robert | -- | Meridian Title | |
| American Pension Services Fub | -- | Meridian Title | |
| Icas Lc | -- | Surety Title | |
| Madsen Margaret | -- | Equity Title |
Source: Public Records
Tax History Compared to Growth
Tax History
| Year | Tax Paid | Tax Assessment Tax Assessment Total Assessment is a certain percentage of the fair market value that is determined by local assessors to be the total taxable value of land and additions on the property. | Land | Improvement |
|---|---|---|---|---|
| 2025 | $2,801 | $515,100 | $154,500 | $360,600 |
| 2024 | $2,801 | $536,000 | $160,800 | $375,200 |
| 2023 | $2,835 | $521,400 | $156,400 | $365,000 |
| 2022 | $2,924 | $504,500 | $151,300 | $353,200 |
| 2021 | $2,561 | $400,100 | $120,000 | $280,100 |
| 2020 | $2,751 | $409,100 | $122,700 | $286,400 |
| 2019 | $2,833 | $396,300 | $118,900 | $277,400 |
| 2018 | $0 | $340,100 | $102,000 | $238,100 |
| 2017 | $2,473 | $315,700 | $94,700 | $221,000 |
| 2016 | $2,544 | $308,300 | $92,500 | $215,800 |
| 2015 | $2,553 | $293,300 | $88,000 | $205,300 |
| 2014 | -- | $290,400 | $87,100 | $203,300 |
Source: Public Records
About Governor's Plaza Condominium
Map
Nearby Homes
- 560 E South Temple Unit C101
- 560 E South Temple Unit 201
- 560 E South Temple Unit 802
- 560 E South Temple Unit 302
- 560 E South Temple Unit 704
- 555 E 100 S Unit 105
- 555 E 100 S Unit 106
- 555 E 100 S Unit 206
- 111 S 600 E Unit 7
- 64 F St
- 160 S 600 E Unit 201
- 557 E 1st Ave Unit 12
- 625 E 200 S Unit 1
- 450 E 100 S Unit 4
- 136 S 700 E Unit 2
- 136 S 700 E Unit 1
- 636 E 2nd Ave
- 110 S 800 E Unit 402
- 710 E 200 S Unit 4F
- 777 E South Temple St Unit 4I
- 560 E South Temple Unit 801
- 560 E South Temple Unit P101
- 560 E South Temple Unit 402
- 560 E South Temple Unit 508
- 560 E South Temple Unit 603
- 560 E South Temple Unit 808
- 560 E South Temple Unit 505
- 560 E South Temple Unit 501
- 560 E South Temple Unit P104
- 560 E South Temple Unit 202
- 560 E South Temple Unit 1107
- 560 E South Temple Unit 906
- 560 E South Temple Unit 608
- 560 E South Temple Unit 604
- 560 E South Temple Unit 403
- 560 E South Temple Unit 908
- 560 E South Temple Unit 708
- 560 E South Temple Unit 706
- 560 E South Temple Unit 707
- 560 E South Temple Unit 607