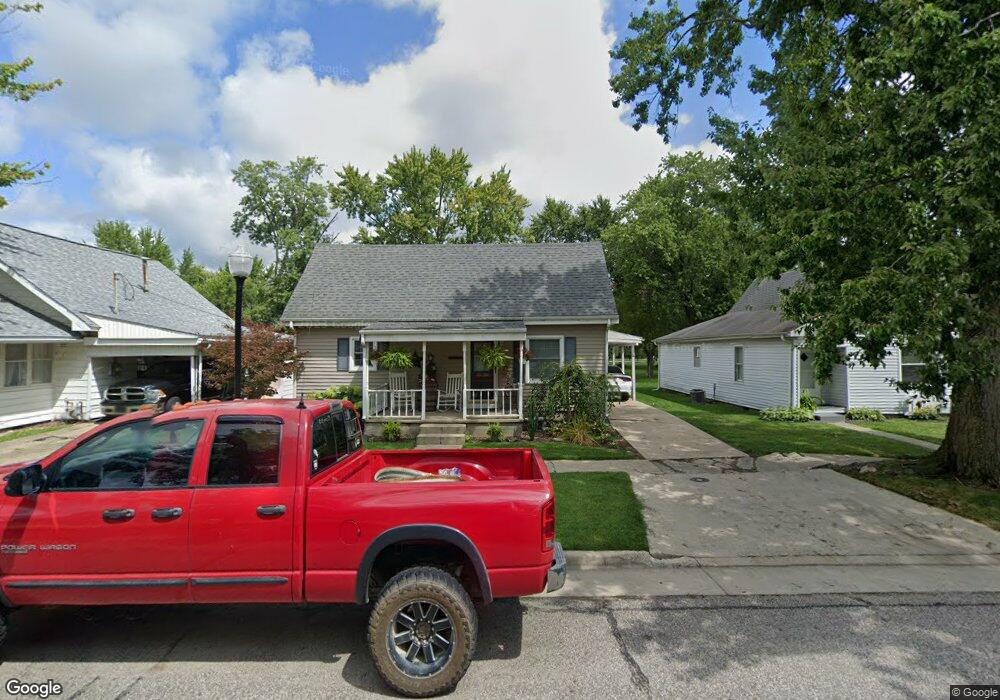
560 H St NE Linton, IN 47441
Estimated Value: $121,186 - $165,000
--
Bed
1
Bath
1,552
Sq Ft
$92/Sq Ft
Est. Value
About This Home
This home is located at 560 H St NE, Linton, IN 47441 and is currently estimated at $142,297, approximately $91 per square foot. 560 H St NE is a home located in Greene County with nearby schools including Linton-Stockton Elementary School, Linton-Stockton Junior High School, and Linton-Stockton High School.
Ownership History
Date
Name
Owned For
Owner Type
Purchase Details
Closed on
Jan 27, 2005
Sold by
Massey Rolland Eugene and Hoesman Burnus
Bought by
Henico Jeff D and Henico Jeri S
Current Estimated Value
Home Financials for this Owner
Home Financials are based on the most recent Mortgage that was taken out on this home.
Original Mortgage
$50,000
Interest Rate
8.12%
Mortgage Type
Adjustable Rate Mortgage/ARM
Create a Home Valuation Report for This Property
The Home Valuation Report is an in-depth analysis detailing your home's value as well as a comparison with similar homes in the area
Home Values in the Area
Average Home Value in this Area
Purchase History
| Date | Buyer | Sale Price | Title Company |
|---|---|---|---|
| Henico Jeff D | -- | None Available |
Source: Public Records
Mortgage History
| Date | Status | Borrower | Loan Amount |
|---|---|---|---|
| Previous Owner | Henico Jeff D | $50,000 |
Source: Public Records
Tax History Compared to Growth
Tax History
| Year | Tax Paid | Tax Assessment Tax Assessment Total Assessment is a certain percentage of the fair market value that is determined by local assessors to be the total taxable value of land and additions on the property. | Land | Improvement |
|---|---|---|---|---|
| 2024 | $2,933 | $53,500 | $5,800 | $47,700 |
| 2023 | $3,051 | $53,000 | $5,800 | $47,200 |
| 2022 | $559 | $54,500 | $5,800 | $48,700 |
| 2021 | $529 | $50,300 | $5,800 | $44,500 |
| 2020 | $529 | $50,700 | $5,800 | $44,900 |
| 2019 | $533 | $50,700 | $5,800 | $44,900 |
| 2018 | $560 | $53,400 | $5,800 | $47,600 |
| 2017 | $606 | $58,500 | $5,800 | $52,700 |
| 2016 | $571 | $58,000 | $5,800 | $52,200 |
| 2014 | $474 | $52,300 | $5,800 | $46,500 |
| 2013 | -- | $51,800 | $5,800 | $46,000 |
Source: Public Records
Map
Nearby Homes