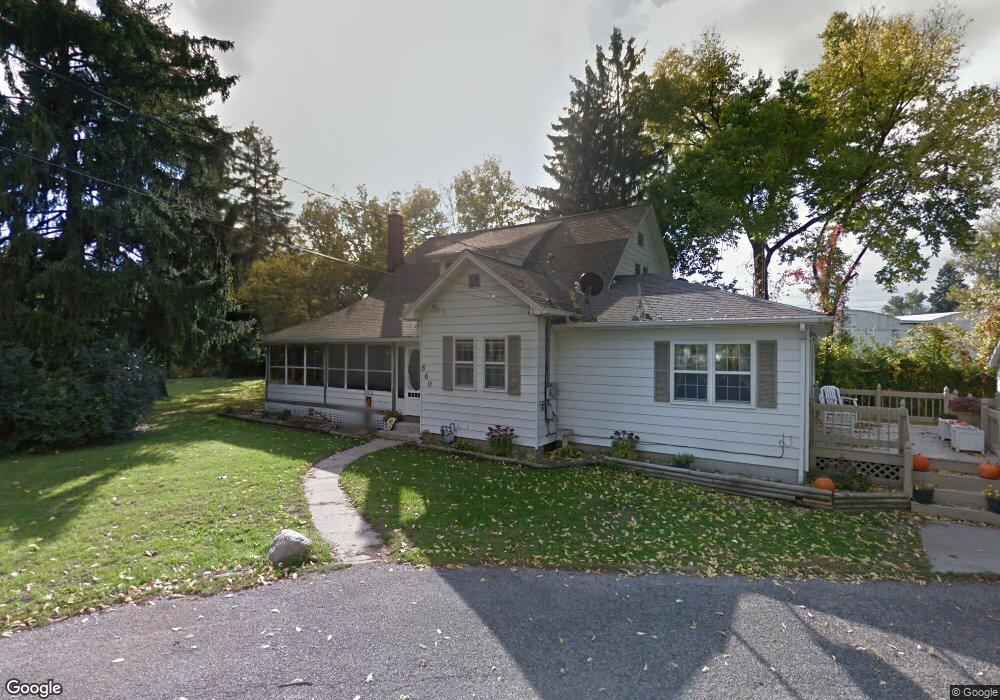
560 Hamlin St Wabash, IN 46992
Estimated Value: $240,000 - $340,000
3
Beds
2
Baths
2,208
Sq Ft
$132/Sq Ft
Est. Value
About This Home
This home is located at 560 Hamlin St, Wabash, IN 46992 and is currently estimated at $291,593, approximately $132 per square foot. 560 Hamlin St is a home located in Wabash County with nearby schools including O.J. Neighbours Elementary School, W C Mills Elementary School, and Wabash Middle School.
Ownership History
Date
Name
Owned For
Owner Type
Purchase Details
Closed on
Jun 16, 2010
Sold by
Secretary Of Hud Of Washington Dc
Bought by
Hyden Brandy Jo and Hyden William Lloyd
Current Estimated Value
Home Financials for this Owner
Home Financials are based on the most recent Mortgage that was taken out on this home.
Original Mortgage
$70,431
Outstanding Balance
$46,948
Interest Rate
4.86%
Mortgage Type
FHA
Estimated Equity
$244,645
Purchase Details
Closed on
Jun 17, 2008
Sold by
Kocher Craig T
Bought by
Citimortgage Inc
Purchase Details
Closed on
Nov 23, 2005
Sold by
Kroh John Steven and Kroh Lisa R
Bought by
Kocher Craig T
Home Financials for this Owner
Home Financials are based on the most recent Mortgage that was taken out on this home.
Original Mortgage
$139,806
Interest Rate
6.17%
Mortgage Type
FHA
Create a Home Valuation Report for This Property
The Home Valuation Report is an in-depth analysis detailing your home's value as well as a comparison with similar homes in the area
Home Values in the Area
Average Home Value in this Area
Purchase History
| Date | Buyer | Sale Price | Title Company |
|---|---|---|---|
| Hyden Brandy Jo | -- | -- | |
| Citimortgage Inc | $161,094 | -- | |
| Kocher Craig T | -- | -- |
Source: Public Records
Mortgage History
| Date | Status | Borrower | Loan Amount |
|---|---|---|---|
| Open | Hyden Brandy Jo | $70,431 | |
| Previous Owner | Kocher Craig T | $139,806 |
Source: Public Records
Tax History Compared to Growth
Tax History
| Year | Tax Paid | Tax Assessment Tax Assessment Total Assessment is a certain percentage of the fair market value that is determined by local assessors to be the total taxable value of land and additions on the property. | Land | Improvement |
|---|---|---|---|---|
| 2024 | $1,299 | $287,200 | $18,900 | $268,300 |
| 2023 | $2,527 | $283,700 | $18,900 | $264,800 |
| 2022 | $2,527 | $252,700 | $15,500 | $237,200 |
| 2021 | $591 | $223,300 | $15,500 | $207,800 |
| 2020 | $591 | $19,700 | $15,500 | $4,200 |
| 2019 | $58 | $127,800 | $15,500 | $112,300 |
| 2018 | $1,227 | $122,500 | $15,500 | $107,000 |
| 2017 | $1,241 | $121,500 | $15,500 | $106,000 |
| 2016 | $786 | $116,500 | $13,700 | $102,800 |
| 2014 | $703 | $118,500 | $13,700 | $104,800 |
| 2013 | $537 | $114,100 | $13,700 | $100,400 |
Source: Public Records
Map
Nearby Homes