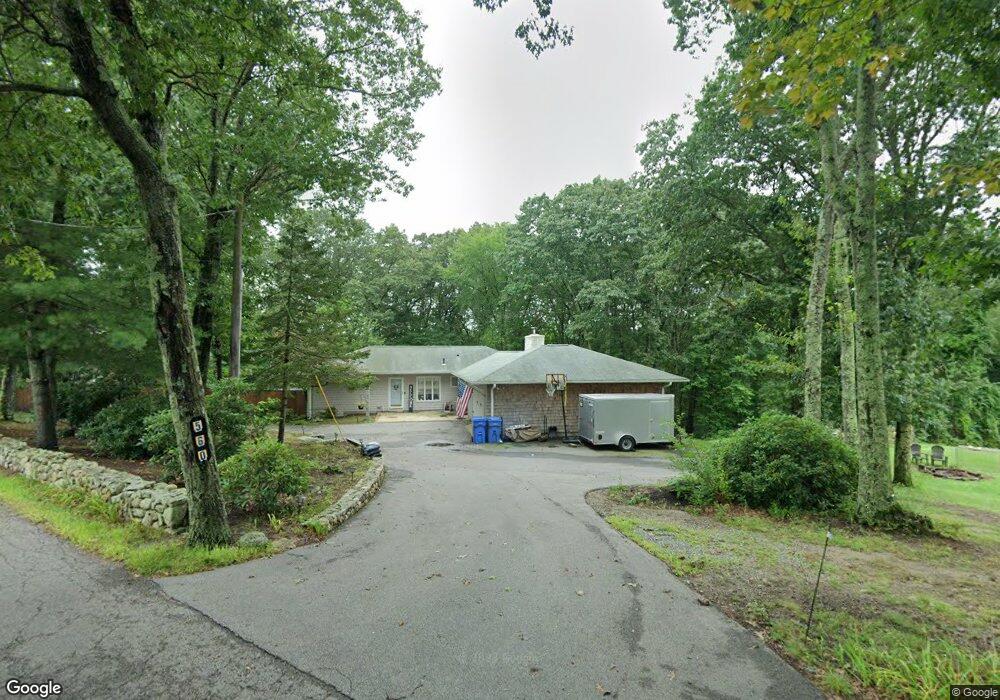
560 Hancock St Wrentham, MA 02093
West Wrentham NeighborhoodEstimated Value: $726,383 - $813,000
4
Beds
3
Baths
1,446
Sq Ft
$540/Sq Ft
Est. Value
About This Home
This home is located at 560 Hancock St, Wrentham, MA 02093 and is currently estimated at $780,346, approximately $539 per square foot. 560 Hancock St is a home located in Norfolk County with nearby schools including Delaney Elementary School and Charles E Roderick.
Ownership History
Date
Name
Owned For
Owner Type
Purchase Details
Closed on
Dec 30, 2016
Sold by
Farrar Maryann
Bought by
Johnson Thomas C and Lopez Johanna L
Current Estimated Value
Home Financials for this Owner
Home Financials are based on the most recent Mortgage that was taken out on this home.
Original Mortgage
$364,000
Outstanding Balance
$298,416
Interest Rate
3.94%
Mortgage Type
New Conventional
Estimated Equity
$481,930
Purchase Details
Closed on
Jan 14, 2000
Sold by
Burns David F and Burns Hedwig R
Bought by
Farrar Maryann
Home Financials for this Owner
Home Financials are based on the most recent Mortgage that was taken out on this home.
Original Mortgage
$100,000
Interest Rate
7.79%
Mortgage Type
Purchase Money Mortgage
Purchase Details
Closed on
Aug 22, 1997
Sold by
Sloboda Alan T and Sloboda March
Bought by
Burns David F and Burns Hedwig R
Home Financials for this Owner
Home Financials are based on the most recent Mortgage that was taken out on this home.
Original Mortgage
$175,920
Interest Rate
7.42%
Mortgage Type
Purchase Money Mortgage
Create a Home Valuation Report for This Property
The Home Valuation Report is an in-depth analysis detailing your home's value as well as a comparison with similar homes in the area
Home Values in the Area
Average Home Value in this Area
Purchase History
| Date | Buyer | Sale Price | Title Company |
|---|---|---|---|
| Johnson Thomas C | $455,000 | -- | |
| Farrar Maryann | $269,900 | -- | |
| Burns David F | $219,900 | -- |
Source: Public Records
Mortgage History
| Date | Status | Borrower | Loan Amount |
|---|---|---|---|
| Open | Johnson Thomas C | $364,000 | |
| Previous Owner | Burns David F | $65,000 | |
| Previous Owner | Burns David F | $100,000 | |
| Previous Owner | Burns David F | $175,920 |
Source: Public Records
Tax History Compared to Growth
Tax History
| Year | Tax Paid | Tax Assessment Tax Assessment Total Assessment is a certain percentage of the fair market value that is determined by local assessors to be the total taxable value of land and additions on the property. | Land | Improvement |
|---|---|---|---|---|
| 2025 | $7,542 | $650,700 | $335,100 | $315,600 |
| 2024 | $7,164 | $597,000 | $335,100 | $261,900 |
| 2023 | $6,949 | $550,600 | $305,100 | $245,500 |
| 2022 | $6,996 | $511,800 | $285,200 | $226,600 |
| 2021 | $6,552 | $465,700 | $249,400 | $216,300 |
| 2020 | $6,246 | $438,300 | $222,400 | $215,900 |
| 2019 | $6,129 | $434,100 | $222,400 | $211,700 |
| 2018 | $5,462 | $383,600 | $200,300 | $183,300 |
| 2017 | $5,153 | $361,600 | $196,400 | $165,200 |
| 2016 | $5,065 | $354,700 | $190,700 | $164,000 |
| 2015 | $4,816 | $321,500 | $183,400 | $138,100 |
| 2014 | $4,895 | $319,700 | $176,400 | $143,300 |
Source: Public Records
Map
Nearby Homes