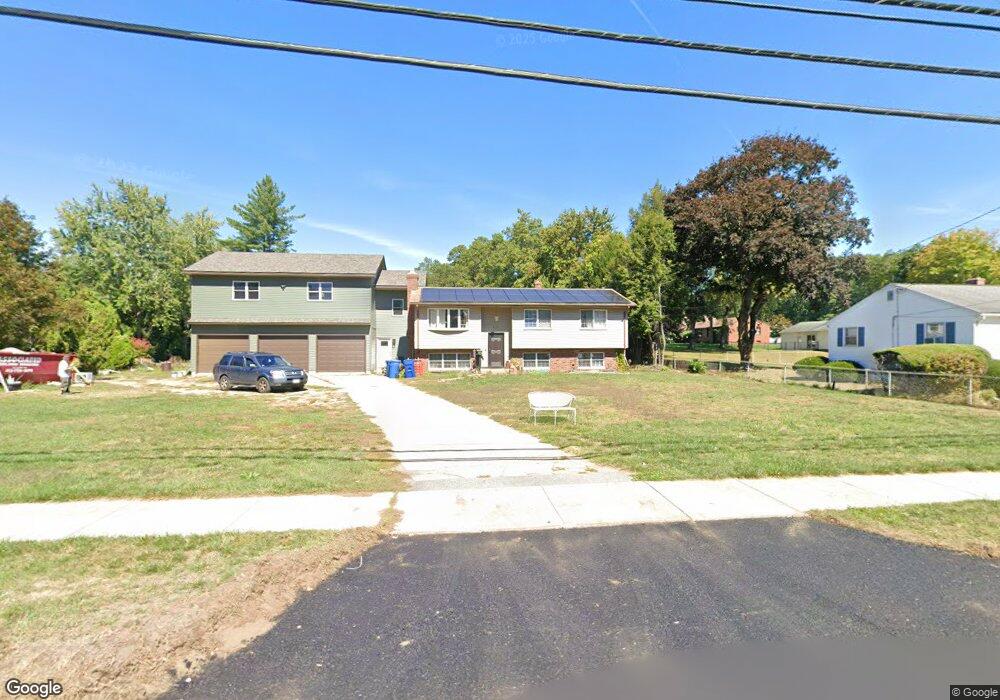
560 Morgan Rd West Springfield, MA 01089
Estimated Value: $343,648 - $381,000
3
Beds
2
Baths
1,063
Sq Ft
$339/Sq Ft
Est. Value
About This Home
This home is located at 560 Morgan Rd, West Springfield, MA 01089 and is currently estimated at $360,412, approximately $339 per square foot. 560 Morgan Rd is a home located in Hampden County with nearby schools including West Springfield High School, Hampden Charter School of Science West, and St Thomas The Apostle School.
Ownership History
Date
Name
Owned For
Owner Type
Purchase Details
Closed on
Sep 14, 2020
Sold by
Nault Glen and Nault Kathleen K
Bought by
Nault Christopher
Current Estimated Value
Home Financials for this Owner
Home Financials are based on the most recent Mortgage that was taken out on this home.
Original Mortgage
$243,200
Interest Rate
2.9%
Mortgage Type
New Conventional
Purchase Details
Closed on
Feb 12, 2020
Sold by
Nault Glen and Nault Kathleen K
Bought by
Nault Christopher
Purchase Details
Closed on
Sep 12, 2018
Sold by
Nault Donald
Bought by
Nault Glen and Nault Kathleen K
Purchase Details
Closed on
Mar 12, 2004
Sold by
Nault Raymond and Nault Rita J
Bought by
Nault Donald and Nault Raymond J
Create a Home Valuation Report for This Property
The Home Valuation Report is an in-depth analysis detailing your home's value as well as a comparison with similar homes in the area
Home Values in the Area
Average Home Value in this Area
Purchase History
We collect this data history from publicly available records. To have your information removed, we recommend requesting removal directly through your county’s website.
| Date | Buyer | Sale Price | Title Company |
|---|---|---|---|
| Nault Christopher | $256,000 | None Available | |
| Nault Christopher | -- | None Available | |
| Nault Glen | -- | None Available | |
| Nault Glen | $200,000 | -- | |
| Nault Donald | -- | -- | |
| Nault Donald A | -- | -- |
Source: Public Records
Mortgage History
We collect this data history from publicly available records. To have your information removed, we recommend requesting removal directly through your county’s website.
| Date | Status | Borrower | Loan Amount |
|---|---|---|---|
| Previous Owner | Nault Christopher | $243,200 |
Source: Public Records
Tax History
| Year | Tax Paid | Tax Assessment Tax Assessment Total Assessment is a certain percentage of the fair market value that is determined by local assessors to be the total taxable value of land and additions on the property. | Land | Improvement |
|---|---|---|---|---|
| 2025 | $4,540 | $305,300 | $128,600 | $176,700 |
| 2024 | $4,504 | $304,100 | $128,600 | $175,500 |
| 2023 | $4,126 | $265,500 | $128,600 | $136,900 |
| 2022 | $3,771 | $239,300 | $116,900 | $122,400 |
| 2021 | $3,517 | $208,100 | $95,600 | $112,500 |
| 2020 | $3,734 | $219,800 | $111,400 | $108,400 |
| 2019 | $3,728 | $219,800 | $111,400 | $108,400 |
| 2018 | $3,819 | $224,000 | $111,400 | $112,600 |
| 2017 | $3,819 | $224,000 | $111,400 | $112,600 |
| 2016 | $3,695 | $217,500 | $106,000 | $111,500 |
| 2015 | $3,622 | $213,200 | $103,900 | $109,300 |
| 2014 | $879 | $213,200 | $103,900 | $109,300 |
Source: Public Records
Map
Nearby Homes
- 300 Circle Dr
- 0 Ahiska Rd Unit 73477754
- 25 Piper Cross Rd
- 1211 Piper Rd
- 36 Shady Brook
- 38 Shady Brook
- 71 Jennifer Dr
- 72 Paulson Dr
- 1193 Amostown Rd
- 1318 Piper Rd
- 543 Amostown Rd
- 2 Windpath E
- 51 Lantern Ln
- 291 Forest Glen
- 13 Parkwood Dr
- 256 Morton St
- 80 Brush Hill Ave Unit 65
- 80 Brush Hill Ave Unit 51
- 80 Brush Hill Ave Unit 40
- 3 John Dr
Your Personal Tour Guide
Ask me questions while you tour the home.