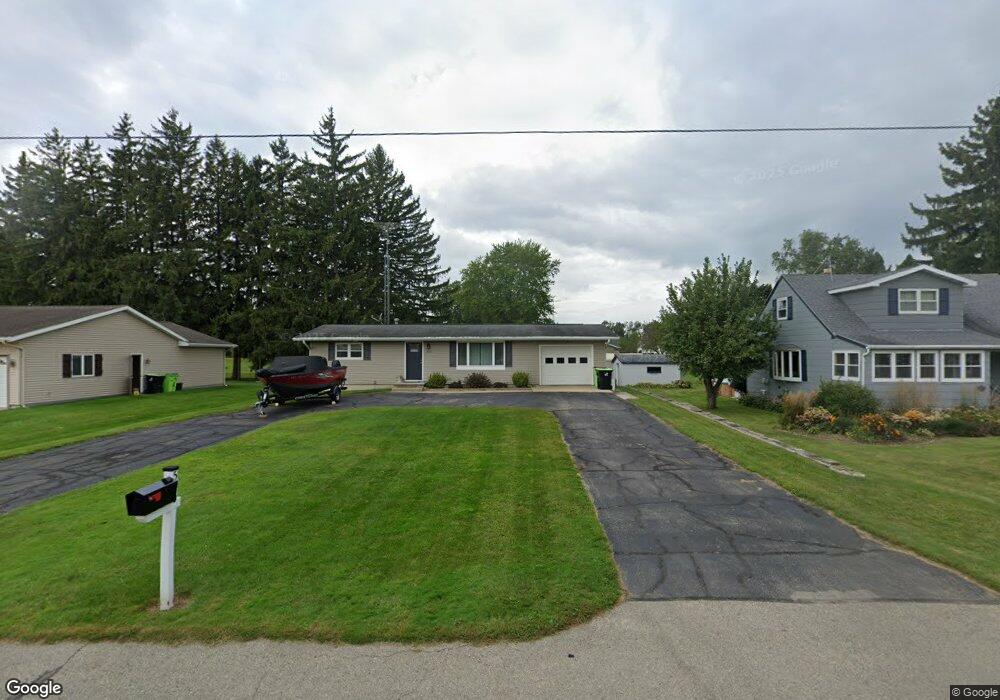
560 N Lockin St Brandon, WI 53919
Estimated Value: $222,000 - $291,000
2
Beds
1
Bath
1,040
Sq Ft
$232/Sq Ft
Est. Value
About This Home
This home is located at 560 N Lockin St, Brandon, WI 53919 and is currently estimated at $241,097, approximately $231 per square foot. 560 N Lockin St is a home located in Fond du Lac County with nearby schools including Rosendale Primary School, Rosendale Intermediate School, and Brandon Middle School.
Ownership History
Date
Name
Owned For
Owner Type
Purchase Details
Closed on
May 7, 2010
Sold by
Wisconsin Housing And Economic Developme
Bought by
Oosterhouse Cody R
Current Estimated Value
Home Financials for this Owner
Home Financials are based on the most recent Mortgage that was taken out on this home.
Original Mortgage
$78,476
Outstanding Balance
$53,239
Interest Rate
5.3%
Mortgage Type
Purchase Money Mortgage
Estimated Equity
$187,858
Purchase Details
Closed on
Jan 22, 2010
Sold by
Borske Elmer A and Borske Kitty M
Bought by
Wisconsin Housing And Economic Developme
Purchase Details
Closed on
Oct 26, 2006
Sold by
Qualls Gwen M
Bought by
Borske Elmer A
Home Financials for this Owner
Home Financials are based on the most recent Mortgage that was taken out on this home.
Original Mortgage
$10,000
Interest Rate
6%
Mortgage Type
Stand Alone Second
Create a Home Valuation Report for This Property
The Home Valuation Report is an in-depth analysis detailing your home's value as well as a comparison with similar homes in the area
Purchase History
| Date | Buyer | Sale Price | Title Company |
|---|---|---|---|
| Oosterhouse Cody R | $79,000 | None Available | |
| Wisconsin Housing And Economic Developme | -- | None Available | |
| Borske Elmer A | $117,000 | None Available |
Source: Public Records
Mortgage History
| Date | Status | Borrower | Loan Amount |
|---|---|---|---|
| Open | Oosterhouse Cody R | $78,476 | |
| Previous Owner | Borske Elmer A | $10,000 | |
| Previous Owner | Borske Elmer A | $111,150 |
Source: Public Records
Tax History
| Year | Tax Paid | Tax Assessment Tax Assessment Total Assessment is a certain percentage of the fair market value that is determined by local assessors to be the total taxable value of land and additions on the property. | Land | Improvement |
|---|---|---|---|---|
| 2024 | $2,754 | $107,400 | $13,200 | $94,200 |
| 2023 | $2,653 | $107,400 | $13,200 | $94,200 |
| 2022 | $2,038 | $107,400 | $13,200 | $94,200 |
| 2021 | $2,120 | $107,400 | $13,200 | $94,200 |
| 2020 | $2,136 | $107,400 | $13,200 | $94,200 |
| 2019 | $2,108 | $107,400 | $13,200 | $94,200 |
| 2018 | $2,266 | $107,400 | $13,200 | $94,200 |
| 2017 | $2,332 | $107,400 | $13,200 | $94,200 |
| 2016 | $2,254 | $107,400 | $13,200 | $94,200 |
| 2015 | $2,228 | $107,200 | $13,200 | $94,000 |
| 2014 | $2,251 | $107,200 | $13,200 | $94,000 |
| 2013 | $2,281 | $107,200 | $13,200 | $94,000 |
Source: Public Records
Map
Nearby Homes
- 12649 W State Road 49 Rd
- N5952 Metovale Rd
- W11360 Raube Rd
- N5449 County Road M
- N5449 County M Rd
- W12308 Reeds Corners Rd
- 207 Main St
- W13325 County Road As
- Lt42 Karau Ave
- Lt43 Karau Ave
- Lt44 Karau Ave
- Lt46 Karau Ave
- Lt47 Karau Ave
- Lt48 Karau Ave
- Lt21 Karau Ave
- Lot 28 & 30 Karau Ave
- 812 Lakeview Ln
- 814 Lakeview Ln
- 436 Sandmar Dr
- 512 Village Ln
- 550 N Lockin St
- 540 N Lockin St
- 565 N Lockin St
- 580 N Lockin St
- 555 N Lockin St
- 585 N Lockin St
- 147 Lincoln Blvd
- 142 Lincoln Blvd
- 535 N Lockin St
- 605 N Lockin St
- 530 N Lockin St
- 610 N Lockin St
- 132 Lincoln Blvd
- 137 Lincoln Blvd
- 620 N Lockin St
- 525 N Lockin St
- 520 N Lockin St
- 630 N Lockin St
- 635 N Lockin St
- 122 Lincoln Blvd
Your Personal Tour Guide
Ask me questions while you tour the home.