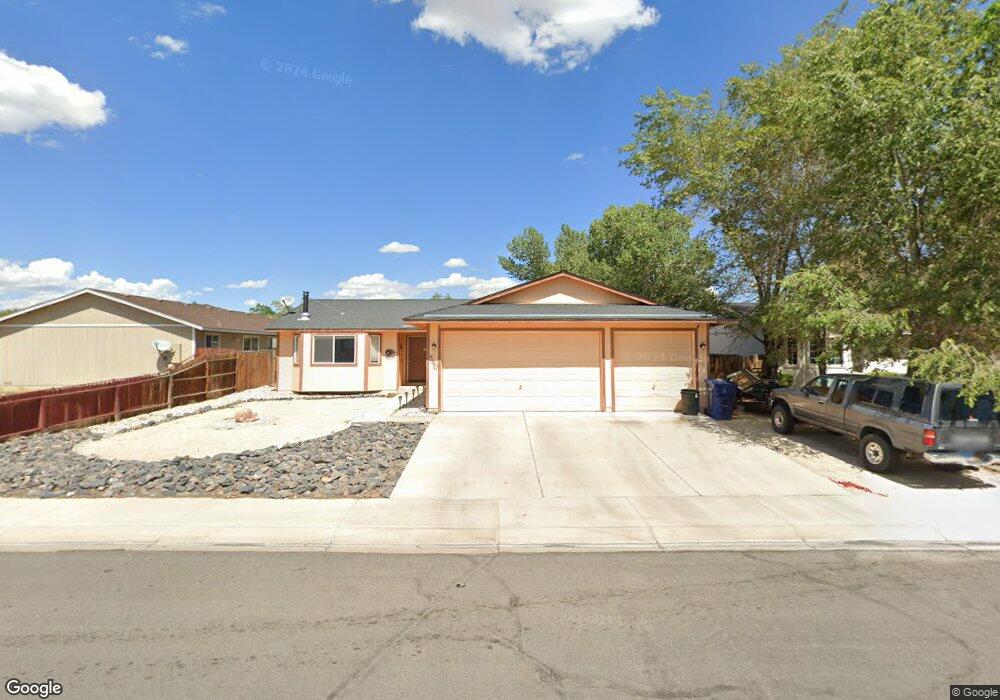
560 Nader Way Fernley, NV 89408
Estimated Value: $356,000 - $382,000
3
Beds
2
Baths
1,566
Sq Ft
$237/Sq Ft
Est. Value
About This Home
This home is located at 560 Nader Way, Fernley, NV 89408 and is currently estimated at $371,203, approximately $237 per square foot. 560 Nader Way is a home located in Lyon County with nearby schools including Fernley Elementary School, Fernley Intermediate School, and Fernley High School.
Ownership History
Date
Name
Owned For
Owner Type
Purchase Details
Closed on
Jan 26, 2017
Sold by
Miller Vince
Bought by
Miller Vince
Current Estimated Value
Home Financials for this Owner
Home Financials are based on the most recent Mortgage that was taken out on this home.
Original Mortgage
$141,000
Outstanding Balance
$116,611
Interest Rate
4.16%
Mortgage Type
New Conventional
Estimated Equity
$254,592
Purchase Details
Closed on
Jul 14, 2010
Sold by
Wells Fargo Bank Na
Bought by
Miller Vince
Home Financials for this Owner
Home Financials are based on the most recent Mortgage that was taken out on this home.
Original Mortgage
$78,000
Interest Rate
4.65%
Mortgage Type
Purchase Money Mortgage
Purchase Details
Closed on
May 10, 2010
Sold by
Walker Michael W and Walker Michelle L
Bought by
Wells Fargo Bank N A
Create a Home Valuation Report for This Property
The Home Valuation Report is an in-depth analysis detailing your home's value as well as a comparison with similar homes in the area
Home Values in the Area
Average Home Value in this Area
Purchase History
| Date | Buyer | Sale Price | Title Company |
|---|---|---|---|
| Miller Vince | -- | Western Title Co | |
| Miller Vince | $91,000 | Service Link | |
| Wells Fargo Bank N A | $65,625 | Lsi Title Agency Inc |
Source: Public Records
Mortgage History
| Date | Status | Borrower | Loan Amount |
|---|---|---|---|
| Open | Miller Vince | $141,000 | |
| Closed | Miller Vince | $78,000 |
Source: Public Records
Tax History Compared to Growth
Tax History
| Year | Tax Paid | Tax Assessment Tax Assessment Total Assessment is a certain percentage of the fair market value that is determined by local assessors to be the total taxable value of land and additions on the property. | Land | Improvement |
|---|---|---|---|---|
| 2025 | $1,443 | $102,993 | $49,000 | $53,993 |
| 2024 | $1,810 | $103,442 | $49,000 | $54,442 |
| 2023 | $1,810 | $96,605 | $45,500 | $51,105 |
| 2022 | $1,708 | $92,917 | $45,500 | $47,417 |
| 2021 | $1,695 | $91,834 | $45,500 | $46,334 |
| 2020 | $1,653 | $80,948 | $36,750 | $44,198 |
| 2019 | $1,633 | $72,419 | $29,750 | $42,669 |
| 2018 | $1,601 | $66,229 | $24,500 | $41,729 |
| 2017 | $1,599 | $59,278 | $17,500 | $41,778 |
| 2016 | $1,413 | $46,377 | $5,780 | $40,597 |
| 2015 | $1,449 | $31,181 | $5,780 | $25,401 |
| 2014 | $1,417 | $30,654 | $5,780 | $24,874 |
Source: Public Records
Map
Nearby Homes