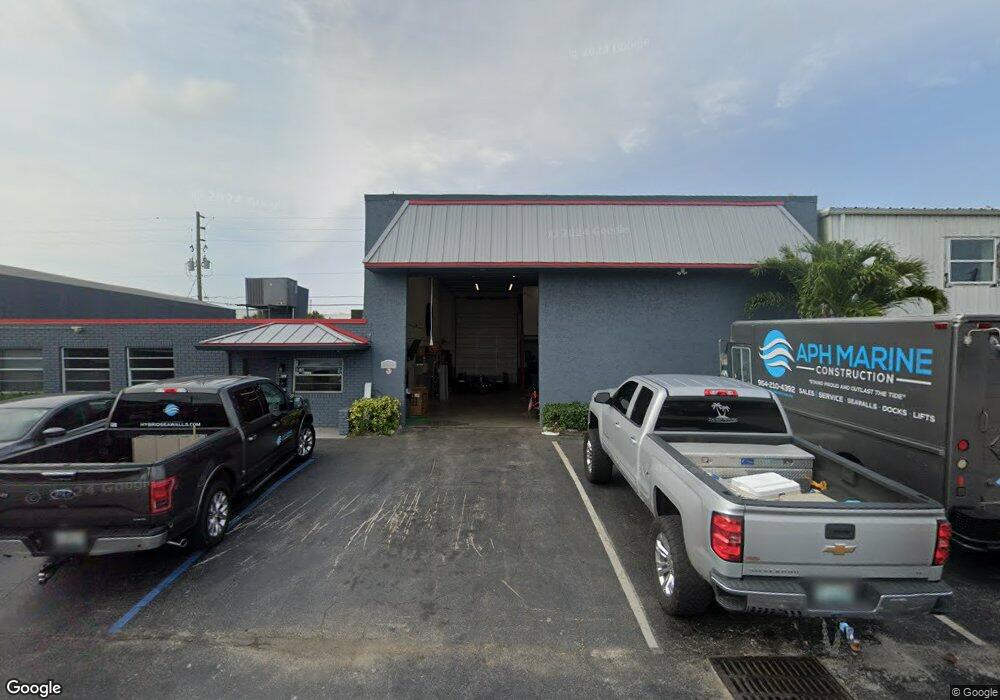
560 NE 26th Ct Pompano Beach, FL 33064
Cresthaven NeighborhoodEstimated Value: $1,266,546
--
Bed
--
Bath
4,977
Sq Ft
$254/Sq Ft
Est. Value
About This Home
This home is located at 560 NE 26th Ct, Pompano Beach, FL 33064 and is currently estimated at $1,266,546, approximately $254 per square foot. 560 NE 26th Ct is a home located in Broward County with nearby schools including Cresthaven Elementary School, Crystal Lake Middle School, and Deerfield Beach High School.
Ownership History
Date
Name
Owned For
Owner Type
Purchase Details
Closed on
Sep 4, 2020
Sold by
Hk Property Investments Llc
Bought by
Gould Timothy E and Gould Deborah E
Current Estimated Value
Home Financials for this Owner
Home Financials are based on the most recent Mortgage that was taken out on this home.
Original Mortgage
$344,000
Outstanding Balance
$184,006
Interest Rate
2.8%
Mortgage Type
Future Advance Clause Open End Mortgage
Estimated Equity
$1,082,540
Purchase Details
Closed on
Feb 12, 2013
Sold by
Fun Fishing Inc
Bought by
Hk Property Investments Llc
Home Financials for this Owner
Home Financials are based on the most recent Mortgage that was taken out on this home.
Original Mortgage
$264,000
Interest Rate
3.35%
Mortgage Type
Commercial
Purchase Details
Closed on
Apr 12, 1999
Sold by
Pompano Export Inc
Bought by
Funfishing Inc
Purchase Details
Closed on
Sep 1, 1980
Sold by
Available Not
Bought by
Available Not
Create a Home Valuation Report for This Property
The Home Valuation Report is an in-depth analysis detailing your home's value as well as a comparison with similar homes in the area
Home Values in the Area
Average Home Value in this Area
Purchase History
| Date | Buyer | Sale Price | Title Company |
|---|---|---|---|
| Gould Timothy E | $800,000 | Attorney | |
| Hk Property Investments Llc | $330,000 | Attorney | |
| Funfishing Inc | $235,000 | -- | |
| Available Not | $54,286 | -- |
Source: Public Records
Mortgage History
| Date | Status | Borrower | Loan Amount |
|---|---|---|---|
| Open | Gould Timothy E | $344,000 | |
| Previous Owner | Hk Property Investments Llc | $264,000 |
Source: Public Records
Tax History Compared to Growth
Tax History
| Year | Tax Paid | Tax Assessment Tax Assessment Total Assessment is a certain percentage of the fair market value that is determined by local assessors to be the total taxable value of land and additions on the property. | Land | Improvement |
|---|---|---|---|---|
| 2025 | $20,943 | $980,010 | $70,180 | $909,830 |
| 2024 | $19,514 | $980,010 | $70,180 | $909,830 |
| 2023 | $19,514 | $847,990 | $0 | $0 |
| 2022 | $17,228 | $770,900 | $70,180 | $700,720 |
| 2021 | $16,078 | $720,500 | $70,180 | $650,320 |
| 2020 | $11,563 | $546,730 | $70,180 | $476,550 |
| 2019 | $11,037 | $546,730 | $70,180 | $476,550 |
| 2018 | $9,359 | $407,760 | $70,180 | $337,580 |
| 2017 | $8,758 | $393,940 | $0 | $0 |
| 2016 | $8,008 | $358,130 | $0 | $0 |
| 2015 | $7,497 | $325,580 | $0 | $0 |
| 2014 | $7,008 | $300,590 | $0 | $0 |
| 2013 | -- | $283,210 | $70,180 | $213,030 |
Source: Public Records
Map
Nearby Homes
- 2541 NE 7th Terrace
- 2600 NE 8th Ave
- 2840 NE 7th Terrace
- 2701 NE 9th Ave
- 2731 NE 9th Ave
- 2841 NE 8th Terrace
- 2380 NE 8th Ave
- 730 NE 23rd Place
- 2920 NE 8th Terrace
- 2921 NE 9th Ave
- 2630 NE Ne 10th Ave
- 910 NE 23rd Place
- 2410 NE 2nd Terrace
- 216 NE 26th St
- 2910 NE 10th Ave
- 931 NE 23rd St
- 26 Havenwood Dr
- 221 NE 24th St
- 2731 NE 11th Terrace
- 2533 NE 12th Terrace
- 601 NE 26th Ct
- 518 NE 26th Ct
- 501 NE 26th Ct
- 2650 NE 7th Ave
- 400 NE 27th St
- 2631 NE 7th Terrace
- 2641 NE 7th Terrace
- 2621 NE 7th Terrace
- 2611 NE 7th Terrace
- 2690 NE 7th Ave
- 2651 NE 7th Terrace
- 2651 NW 4th Ave
- 2601 NE 7th Terrace
- 2701 NE 7th Terrace
- 2551 NE 7th Terrace
- 2711 NE 7th Terrace
- 650 NE 28th St Unit C & D
- 2630 NE 7th Terrace
- 2640 NE 7th Terrace
- 2530 NE 5th Ave