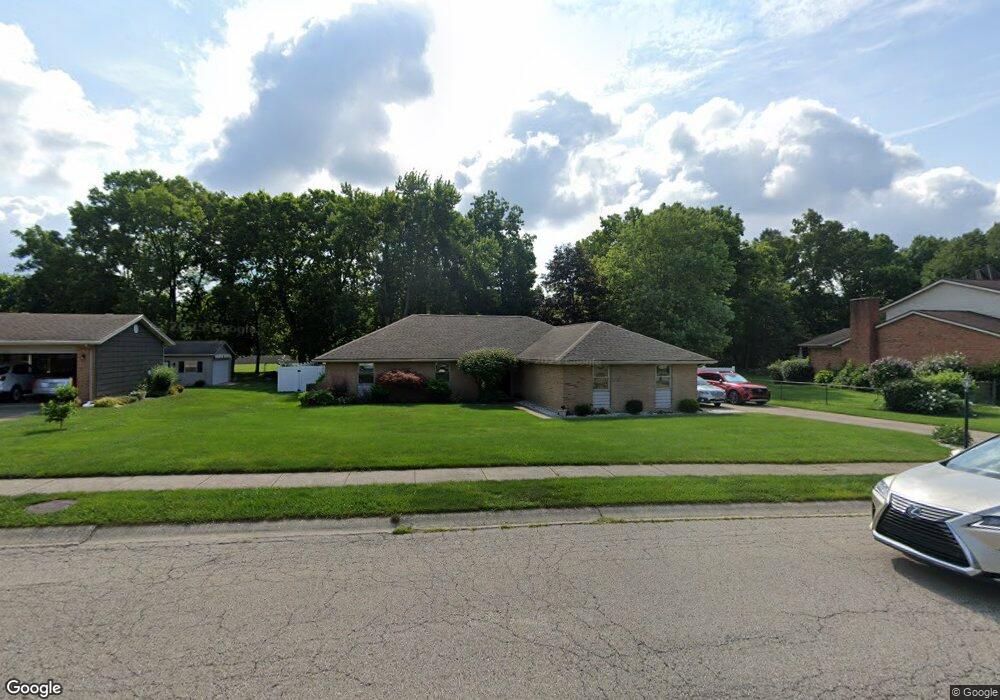
560 Queensgate Rd Springboro, OH 45066
Estimated Value: $321,000 - $404,000
3
Beds
2
Baths
1,768
Sq Ft
$197/Sq Ft
Est. Value
About This Home
This home is located at 560 Queensgate Rd, Springboro, OH 45066 and is currently estimated at $347,906, approximately $196 per square foot. 560 Queensgate Rd is a home located in Warren County with nearby schools including Clearcreek Elementary School, Springboro Intermediate School, and Dennis Elementary School.
Ownership History
Date
Name
Owned For
Owner Type
Purchase Details
Closed on
Jun 30, 1994
Sold by
Risner Gregory S
Bought by
Reinhart and Reinhart Edda Koppen
Current Estimated Value
Home Financials for this Owner
Home Financials are based on the most recent Mortgage that was taken out on this home.
Original Mortgage
$123,500
Interest Rate
8.66%
Mortgage Type
New Conventional
Purchase Details
Closed on
Mar 11, 1991
Sold by
Lee Lee and Lee Gary W
Bought by
Risner Risner and Risner Gregory S
Purchase Details
Closed on
Jun 15, 1987
Sold by
Leesemann Leesemann and Leesemann Gregory H
Bought by
Lee Lee and Lee Gary W
Purchase Details
Closed on
Feb 7, 1985
Sold by
Leesemann Leesemann and Leesemann Gregory H
Bought by
Leesemann Leesemann and Leesemann Gregory H
Purchase Details
Closed on
Sep 2, 1981
Sold by
Angel Enterprises & Inc and Thurstlic John J
Purchase Details
Closed on
May 25, 1979
Sold by
Lsm Corp
Purchase Details
Closed on
Jul 25, 1978
Sold by
Lsm Corp
Create a Home Valuation Report for This Property
The Home Valuation Report is an in-depth analysis detailing your home's value as well as a comparison with similar homes in the area
Home Values in the Area
Average Home Value in this Area
Purchase History
| Date | Buyer | Sale Price | Title Company |
|---|---|---|---|
| Reinhart | $130,000 | -- | |
| Risner Risner | $117,000 | -- | |
| Lee Lee | $88,000 | -- | |
| Leesemann Leesemann | -- | -- | |
| -- | $79,500 | -- | |
| -- | $174,000 | -- | |
| -- | -- | -- |
Source: Public Records
Mortgage History
| Date | Status | Borrower | Loan Amount |
|---|---|---|---|
| Closed | Reinhart | $123,500 |
Source: Public Records
Tax History
| Year | Tax Paid | Tax Assessment Tax Assessment Total Assessment is a certain percentage of the fair market value that is determined by local assessors to be the total taxable value of land and additions on the property. | Land | Improvement |
|---|---|---|---|---|
| 2024 | $3,735 | $95,650 | $31,500 | $64,150 |
| 2023 | $3,107 | $72,968 | $16,940 | $56,028 |
| 2022 | $3,062 | $72,968 | $16,940 | $56,028 |
| 2021 | $2,849 | $72,968 | $16,940 | $56,028 |
| 2020 | $2,694 | $60,305 | $14,000 | $46,305 |
| 2019 | $2,484 | $60,305 | $14,000 | $46,305 |
| 2018 | $2,485 | $60,305 | $14,000 | $46,305 |
| 2017 | $2,378 | $51,975 | $12,250 | $39,725 |
| 2016 | $2,480 | $51,975 | $12,250 | $39,725 |
| 2015 | $2,452 | $51,975 | $12,250 | $39,725 |
| 2014 | $2,452 | $48,570 | $11,450 | $37,120 |
| 2013 | $2,450 | $59,400 | $14,000 | $45,400 |
Source: Public Records
Map
Nearby Homes
- 510 Royal Springs Dr
- 1101 Parklake Row
- 350 Spruceway Dr
- 72 Tamarack Trail
- 1785 Archerfield Place
- 11138 Oakwood Village Blvd
- 23 Pheasant Run Cir Unit 9A
- 205 Springhouse Dr
- 245 Whispering Pines St
- 20 Terradyne Trace
- 10862 Jandor Place
- 51 Abbey Dr Unit 51
- 41 Villa Pointe Dr
- 92 Villa Pointe Dr Unit 92
- 20 Fairfield Ct
- 284 Mcdaniels Ln
- 72 Crockett Dr
- 25 Blose Ct
- 265 Mcdaniels Ln
- 85 Meadows Dr
- 550 Queensgate Rd
- 570 Queensgate Rd
- 540 Queensgate Rd
- 580 Queensgate Rd
- 565 Queensgate Rd
- 555 Queensgate Rd
- 575 Queensgate Rd
- 530 Queensgate Rd
- 590 Queensgate Rd
- 545 Queensgate Rd
- 585 Queensgate Rd
- 535 Queensgate Rd
- 570 Royal Springs Dr
- 560 Royal Springs Dr
- 595 Queensgate Rd
- 520 Queensgate Rd
- 600 Queensgate Rd
- 580 Royal Springs Dr
- 2750 Westminster Way
- 550 Royal Springs Dr