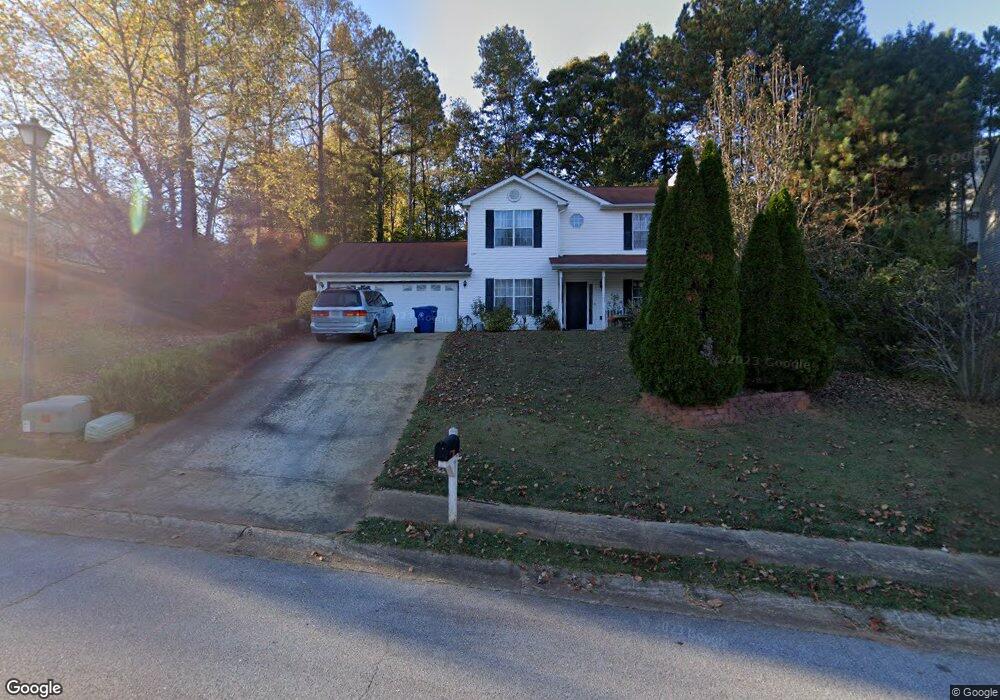
560 Saddle Path Bend Unit IV Lawrenceville, GA 30046
Estimated Value: $319,000 - $381,000
3
Beds
2
Baths
1,688
Sq Ft
$201/Sq Ft
Est. Value
About This Home
This home is located at 560 Saddle Path Bend Unit IV, Lawrenceville, GA 30046 and is currently estimated at $339,999, approximately $201 per square foot. 560 Saddle Path Bend Unit IV is a home located in Gwinnett County with nearby schools including Jenkins Elementary School, Jordan Middle School, and Central Gwinnett High School.
Ownership History
Date
Name
Owned For
Owner Type
Purchase Details
Closed on
Jul 27, 2001
Sold by
Baker Patricia C
Bought by
Muhic Azem and Muhic Medina
Current Estimated Value
Home Financials for this Owner
Home Financials are based on the most recent Mortgage that was taken out on this home.
Original Mortgage
$122,220
Outstanding Balance
$47,469
Interest Rate
7.09%
Mortgage Type
New Conventional
Estimated Equity
$292,530
Purchase Details
Closed on
Jul 30, 1999
Sold by
Harvilla Thomas M
Bought by
Baker Patricia C
Home Financials for this Owner
Home Financials are based on the most recent Mortgage that was taken out on this home.
Original Mortgage
$110,800
Interest Rate
7.66%
Mortgage Type
FHA
Purchase Details
Closed on
Nov 8, 1996
Sold by
Outler Hugh L
Bought by
Harvilla Thomas M
Purchase Details
Closed on
Aug 13, 1996
Sold by
Approved Investments Ltd
Bought by
Outler Hugh L
Create a Home Valuation Report for This Property
The Home Valuation Report is an in-depth analysis detailing your home's value as well as a comparison with similar homes in the area
Home Values in the Area
Average Home Value in this Area
Purchase History
| Date | Buyer | Sale Price | Title Company |
|---|---|---|---|
| Muhic Azem | $126,000 | -- | |
| Baker Patricia C | $111,800 | -- | |
| Harvilla Thomas M | $100,700 | -- | |
| Outler Hugh L | $20,500 | -- |
Source: Public Records
Mortgage History
| Date | Status | Borrower | Loan Amount |
|---|---|---|---|
| Open | Muhic Azem | $122,220 | |
| Previous Owner | Baker Patricia C | $110,800 | |
| Closed | Outler Hugh L | $0 |
Source: Public Records
Tax History Compared to Growth
Tax History
| Year | Tax Paid | Tax Assessment Tax Assessment Total Assessment is a certain percentage of the fair market value that is determined by local assessors to be the total taxable value of land and additions on the property. | Land | Improvement |
|---|---|---|---|---|
| 2024 | $2,604 | $112,360 | $22,000 | $90,360 |
| 2023 | $2,604 | $112,360 | $22,000 | $90,360 |
| 2022 | $2,615 | $112,360 | $22,000 | $90,360 |
| 2021 | $2,204 | $89,520 | $17,600 | $71,920 |
| 2020 | $2,013 | $72,440 | $12,800 | $59,640 |
| 2019 | $1,866 | $66,320 | $12,800 | $53,520 |
| 2018 | $1,816 | $66,320 | $12,800 | $53,520 |
| 2016 | $1,507 | $52,800 | $10,800 | $42,000 |
| 2015 | $1,106 | $37,600 | $6,000 | $31,600 |
| 2014 | $1,113 | $37,600 | $6,000 | $31,600 |
Source: Public Records
Map
Nearby Homes
- 354 Shoal Ct
- 605 Saddle Shoals Dr
- 695 Josh Ln
- 875 Josh Ln
- 785 Josh Ln
- 443 Marsh Lake Rd
- 494 Saddle Shoal Trail
- 605 Ashland Park Way Unit 1
- 690 Springlake Rd
- 248 Springbottom Dr
- 324 Spring Falls Dr
- 240 Ashland Manor Dr Unit 1
- 314 Spring Falls Dr
- 364 Springhaven Way
- 480 Pond Weed Dr
- 395 Paper Mill Dr Unit 1
- 344 Springbottom Ct
- 570 Saddle Path Bend
- 570 Saddle Bnd Path SE
- 550 Saddle Path Bend
- 685 Saddle Shoals Dr
- 747 Shoal Cir
- 675 Saddle Shoals Dr Unit 3
- 695 Saddle Shoals Dr
- 580 Saddle Path Bend
- 665 Saddle Shoals Dr
- 551 Saddle Path Bend
- 757 Shoal Cir Unit 4
- 571 Saddle Path Bend
- 0 Saddle Path Bend Unit 3215052
- 0 Saddle Path Bend Unit 7342615
- 705 Saddle Shoals Dr
- 655 Saddle Shoals Dr
- 697 Shoal Cir Unit 4
- 767 Shoal Cir
- 732 Shoal Cir Unit IV
- 722 Shoal Cir