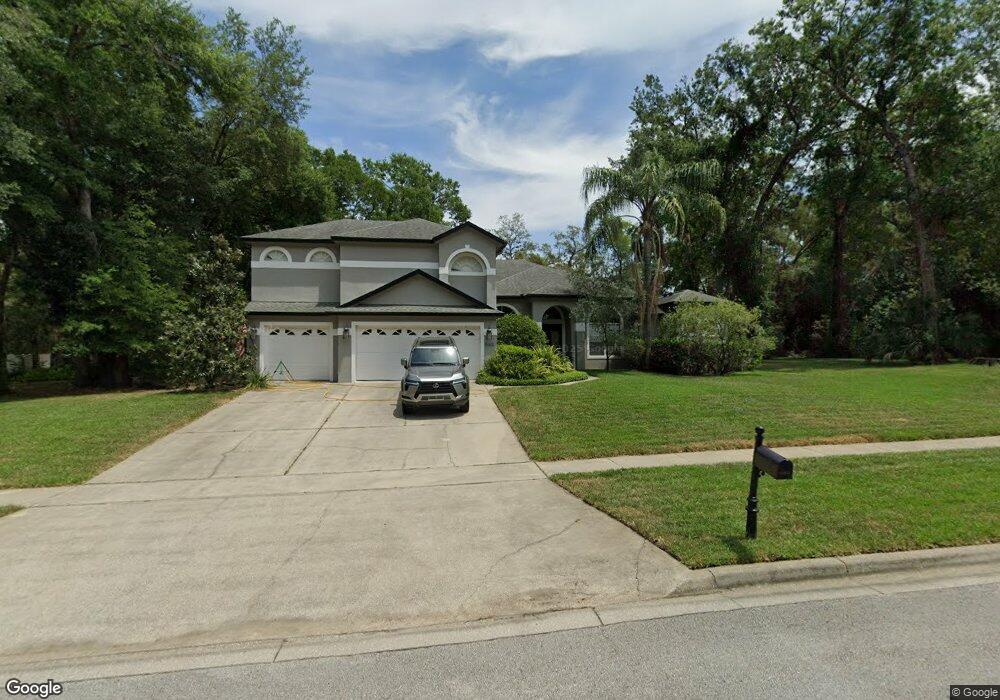
560 Sand Wedge Loop Apopka, FL 32712
Estimated Value: $648,000 - $784,000
4
Beds
3
Baths
4,918
Sq Ft
$142/Sq Ft
Est. Value
About This Home
This home is located at 560 Sand Wedge Loop, Apopka, FL 32712 and is currently estimated at $698,348, approximately $141 per square foot. 560 Sand Wedge Loop is a home located in Orange County with nearby schools including Apopka High School.
Ownership History
Date
Name
Owned For
Owner Type
Purchase Details
Closed on
Apr 2, 2021
Sold by
Strode Ty R and Strode Liana
Bought by
Strode Tyr and Strode Liana E
Current Estimated Value
Purchase Details
Closed on
Oct 27, 2010
Sold by
Gessner Richard J and Gessner Melinda A
Bought by
Strode Ty R and Strode Liana
Home Financials for this Owner
Home Financials are based on the most recent Mortgage that was taken out on this home.
Original Mortgage
$244,000
Outstanding Balance
$161,888
Interest Rate
4.38%
Mortgage Type
New Conventional
Estimated Equity
$536,460
Purchase Details
Closed on
Jan 3, 2002
Sold by
Engle Homes Of Orlando Inc
Bought by
Gessner Richard J and Gessner Melinda A
Home Financials for this Owner
Home Financials are based on the most recent Mortgage that was taken out on this home.
Original Mortgage
$185,000
Interest Rate
6.72%
Mortgage Type
New Conventional
Create a Home Valuation Report for This Property
The Home Valuation Report is an in-depth analysis detailing your home's value as well as a comparison with similar homes in the area
Home Values in the Area
Average Home Value in this Area
Purchase History
| Date | Buyer | Sale Price | Title Company |
|---|---|---|---|
| Strode Tyr | -- | Accommodation | |
| Strode Ty R | $305,000 | Watson Title Services Inc | |
| Gessner Richard J | $325,200 | -- |
Source: Public Records
Mortgage History
| Date | Status | Borrower | Loan Amount |
|---|---|---|---|
| Open | Strode Ty R | $244,000 | |
| Previous Owner | Gessner Richard J | $185,000 |
Source: Public Records
Tax History Compared to Growth
Tax History
| Year | Tax Paid | Tax Assessment Tax Assessment Total Assessment is a certain percentage of the fair market value that is determined by local assessors to be the total taxable value of land and additions on the property. | Land | Improvement |
|---|---|---|---|---|
| 2025 | $4,636 | $331,710 | -- | -- |
| 2024 | $8,512 | $331,710 | -- | -- |
| 2023 | $8,512 | $549,242 | $125,000 | $424,242 |
| 2022 | $7,647 | $486,794 | $125,000 | $361,794 |
| 2021 | $4,102 | $295,007 | $0 | $0 |
| 2020 | $3,932 | $290,934 | $0 | $0 |
| 2019 | $3,999 | $284,393 | $0 | $0 |
| 2018 | $3,965 | $279,090 | $0 | $0 |
| 2017 | $3,325 | $289,428 | $50,000 | $239,428 |
| 2016 | $3,319 | $284,423 | $28,000 | $256,423 |
| 2015 | $3,287 | $279,791 | $28,000 | $251,791 |
| 2014 | $3,312 | $274,904 | $38,000 | $236,904 |
Source: Public Records
Map
Nearby Homes
- 522 Sand Wedge Loop
- 597 Sand Wedge Loop
- 626 Green Rock Ct
- 250 Kentucky Blue Cir
- 873 Gulf Land Dr
- 492 Lanarkshire Place
- 154 W Lewis Ave
- 1132 Bardwell Ct
- 2 E Kelly Park Rd
- 4946 Pierce Arrow Dr
- 4612 Rock Springs Rd
- 328 Longhorn Dr
- 111 Kentucky Blue Cir
- 26 E Kelly Park Rd
- 3835 Rock Hill Loop
- 236 Longhorn Dr
- 423 Spring Hollow Blvd
- 0 Kelly Park Rd E
- 5230 Brahorn Rd
- 5304 Galloway Rd
- 570 Sand Wedge Loop
- 550 Sand Wedge Loop
- 575 Sand Wedge Loop
- 529 Sand Wedge Loop
- 579 Sand Wedge Loop
- 540 Sand Wedge Loop
- 574 Sand Wedge Loop
- 527 Sand Wedge Loop
- 576 Sand Wedge Loop
- 578 Sand Wedge Loop
- 530 Sand Wedge Loop
- 581 Sand Wedge Loop
- 525 Sand Wedge Loop
- 528 Sand Wedge Loop
- 580 Sand Wedge Loop
- 583 Sand Wedge Loop
- 526 Sand Wedge Loop
- 523 Sand Wedge Loop
- 582 Sand Wedge Loop
- 524 Sand Wedge Loop