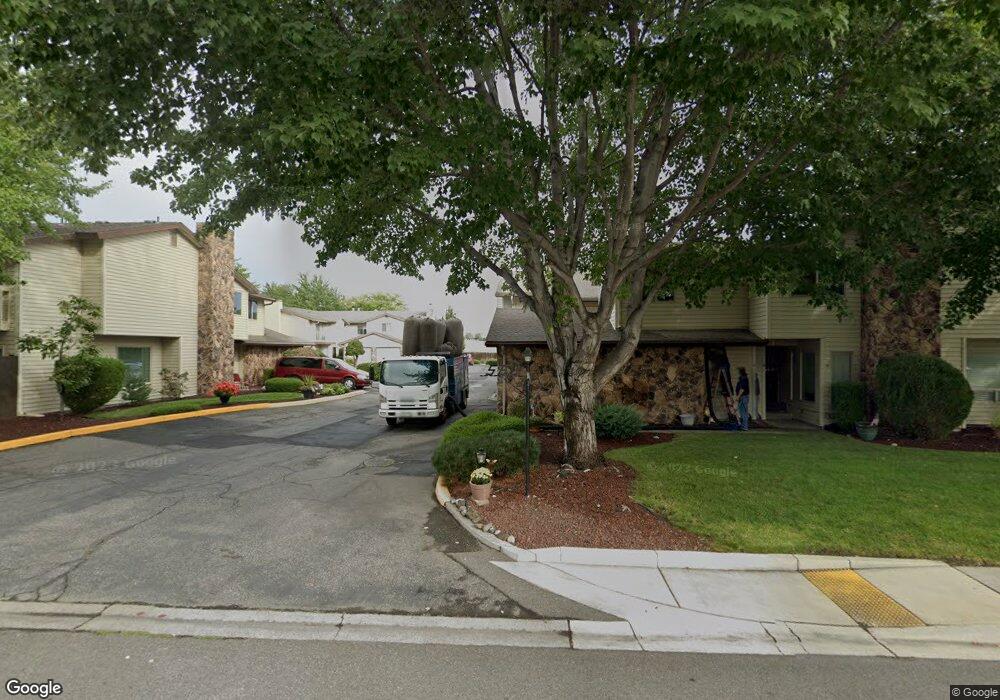
560 Spengler St Unit Q Richland, WA 99354
Estimated Value: $213,000 - $266,000
3
Beds
2
Baths
1,208
Sq Ft
$201/Sq Ft
Est. Value
About This Home
This home is located at 560 Spengler St Unit Q, Richland, WA 99354 and is currently estimated at $242,480, approximately $200 per square foot. 560 Spengler St Unit Q is a home located in Benton County with nearby schools including Sacajawea Elementary School, Chief Joseph Middle School, and Hanford High School.
Ownership History
Date
Name
Owned For
Owner Type
Purchase Details
Closed on
Oct 4, 2019
Sold by
Batcheller Tom and Batcheller Hyonsun
Bought by
Cook Janet
Current Estimated Value
Home Financials for this Owner
Home Financials are based on the most recent Mortgage that was taken out on this home.
Original Mortgage
$140,125
Outstanding Balance
$122,757
Interest Rate
3.5%
Mortgage Type
New Conventional
Estimated Equity
$119,723
Purchase Details
Closed on
Jan 25, 2011
Sold by
Cunningham Jeffrey
Bought by
Batcheller Tom and Batcheller Hyonsun
Home Financials for this Owner
Home Financials are based on the most recent Mortgage that was taken out on this home.
Original Mortgage
$64,000
Interest Rate
4.79%
Mortgage Type
Seller Take Back
Purchase Details
Closed on
Jul 31, 2007
Sold by
Hickey Nathel I
Bought by
Cunningham Jeffrey
Home Financials for this Owner
Home Financials are based on the most recent Mortgage that was taken out on this home.
Original Mortgage
$79,600
Interest Rate
6.66%
Mortgage Type
Purchase Money Mortgage
Create a Home Valuation Report for This Property
The Home Valuation Report is an in-depth analysis detailing your home's value as well as a comparison with similar homes in the area
Home Values in the Area
Average Home Value in this Area
Purchase History
| Date | Buyer | Sale Price | Title Company |
|---|---|---|---|
| Cook Janet | $171,601 | Ticor Title Company | |
| Batcheller Tom | $114,000 | Benton Franklin Title Co | |
| Cunningham Jeffrey | $99,500 | Marshall Title Co |
Source: Public Records
Mortgage History
| Date | Status | Borrower | Loan Amount |
|---|---|---|---|
| Open | Cook Janet | $140,125 | |
| Previous Owner | Batcheller Tom | $64,000 | |
| Previous Owner | Cunningham Jeffrey | $79,600 |
Source: Public Records
Tax History Compared to Growth
Tax History
| Year | Tax Paid | Tax Assessment Tax Assessment Total Assessment is a certain percentage of the fair market value that is determined by local assessors to be the total taxable value of land and additions on the property. | Land | Improvement |
|---|---|---|---|---|
| 2024 | $1,549 | $169,570 | -- | $169,570 |
| 2023 | $1,549 | $163,290 | $0 | $163,290 |
| 2022 | $1,608 | $125,610 | $0 | $125,610 |
| 2021 | $1,436 | $144,450 | $0 | $144,450 |
| 2020 | $1,369 | $125,610 | $0 | $125,610 |
| 2019 | $1,379 | $111,640 | $0 | $111,640 |
| 2018 | $1,375 | $121,790 | $0 | $121,790 |
| 2017 | $1,212 | $101,490 | $0 | $101,490 |
| 2016 | $1,195 | $101,490 | $0 | $101,490 |
| 2015 | $1,217 | $101,490 | $0 | $101,490 |
| 2014 | -- | $101,490 | $0 | $101,490 |
| 2013 | -- | $101,490 | $0 | $101,490 |
Source: Public Records
Map
Nearby Homes
- 560 Spengler St
- 63 Galaxy Ln
- 42 Mercury Dr
- 49 Galaxy Ln
- 2462 Mullet Ct
- 2445 Westmoreland Dr
- 45 Cosmic Ln
- 50 Compton Ln Unit 51
- 721 Hanford St
- 2460 Westmoreland Dr
- 21 Nuclear Ln
- 733 Snyder St
- 2342 Davison Ave
- 324 Saint St
- 562 Fuller St
- 2110 Davison Ave
- 901 W Currie St
- 517 Catskill St
- 515 Blue St
- 2021 Mahan Ave Unit D8
- 560 Spengler St Unit P
- 560 Spengler St Unit D
- 560 Spengler St Unit H
- 560 Spengler St Unit J
- 560 Spengler St Unit K
- 560 Spengler St Unit S
- 560 Spengler St Unit C
- 560 Spengler St Unit A
- 560 Spengler St Unit B
- 560 Spengler St Unit E
- 560 Spengler St Unit F
- 560 Spengler St Unit I
- 560 Spengler St Unit N
- 560 Spengler St Unit O
- 560 Spengler St Unit R
- 560 Spengler St Unit T
- 560 Spengler St #J
- 560 Spengler St #J Unit J
- 560 Spengler St #F