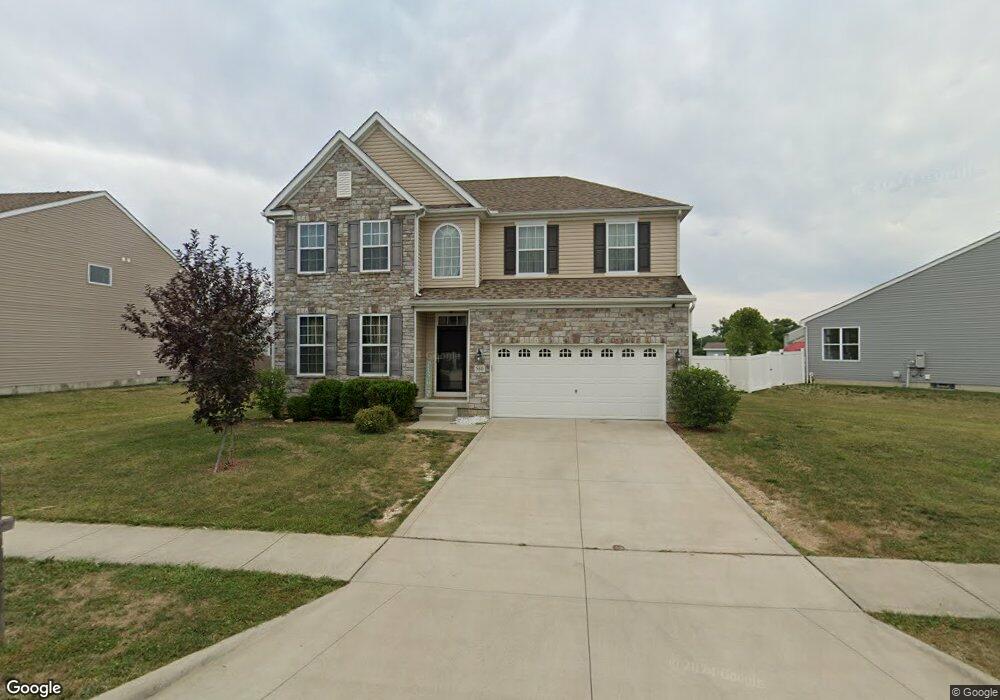
560 Tallman St Groveport, OH 43125
Estimated Value: $318,000 - $552,000
3
Beds
3
Baths
3,160
Sq Ft
$134/Sq Ft
Est. Value
About This Home
This home is located at 560 Tallman St, Groveport, OH 43125 and is currently estimated at $423,914, approximately $134 per square foot. 560 Tallman St is a home with nearby schools including Groveport Madison High School, Groveport Community School, and Madison Christian School.
Ownership History
Date
Name
Owned For
Owner Type
Purchase Details
Closed on
Apr 19, 2024
Sold by
Eggers Robert A
Bought by
Nolcox Mariella M and Eggers Mariella M
Current Estimated Value
Purchase Details
Closed on
Oct 7, 2017
Sold by
Westport Homes Inc
Bought by
Eggers Mariella M and Eggers Robert A
Home Financials for this Owner
Home Financials are based on the most recent Mortgage that was taken out on this home.
Original Mortgage
$302,383
Interest Rate
4.75%
Mortgage Type
FHA
Purchase Details
Closed on
Oct 9, 2015
Sold by
Homewood Corp
Bought by
Westport Homes Inc
Home Financials for this Owner
Home Financials are based on the most recent Mortgage that was taken out on this home.
Original Mortgage
$50,000,000
Interest Rate
3.91%
Mortgage Type
Construction
Purchase Details
Closed on
May 7, 2009
Sold by
Newport Village Ltd
Bought by
Homewood Corporation
Create a Home Valuation Report for This Property
The Home Valuation Report is an in-depth analysis detailing your home's value as well as a comparison with similar homes in the area
Home Values in the Area
Average Home Value in this Area
Purchase History
| Date | Buyer | Sale Price | Title Company |
|---|---|---|---|
| Nolcox Mariella M | -- | None Listed On Document | |
| Eggers Mariella M | $308,000 | None Available | |
| Westport Homes Inc | $456,000 | Clean Title | |
| Homewood Corporation | -- | Preferred T |
Source: Public Records
Mortgage History
| Date | Status | Borrower | Loan Amount |
|---|---|---|---|
| Previous Owner | Eggers Mariella M | $302,383 | |
| Previous Owner | Westport Homes Inc | $50,000,000 |
Source: Public Records
Tax History Compared to Growth
Tax History
| Year | Tax Paid | Tax Assessment Tax Assessment Total Assessment is a certain percentage of the fair market value that is determined by local assessors to be the total taxable value of land and additions on the property. | Land | Improvement |
|---|---|---|---|---|
| 2024 | $6,898 | $141,050 | $24,150 | $116,900 |
| 2023 | $6,837 | $141,050 | $24,150 | $116,900 |
| 2022 | $7,352 | $121,000 | $8,400 | $112,600 |
| 2021 | $7,380 | $121,000 | $8,400 | $112,600 |
| 2020 | $7,397 | $121,000 | $8,400 | $112,600 |
| 2019 | $6,966 | $100,450 | $7,000 | $93,450 |
| 2018 | $3,593 | $100,450 | $7,000 | $93,450 |
| 2017 | $501 | $7,000 | $7,000 | $0 |
| 2016 | $628 | $7,980 | $7,980 | $0 |
| 2015 | $181 | $1,890 | $1,890 | $0 |
| 2014 | $142 | $1,890 | $1,890 | $0 |
| 2013 | $105 | $1,995 | $1,995 | $0 |
Source: Public Records
Map
Nearby Homes
- 456 Benson Dr
- 250 Green Ave
- 336 Lambert St
- 3515 Rohr Rd
- 3450 Rohr Rd
- 0 Pontius Rd
- 3463 Rohr Rd
- 287 College St
- 3461 Rohr Rd
- 199 Mohr Ave
- 537 Blacklick St
- 111 Church St
- 135 Front St
- 3339 Lauren Fields Dr S
- 4868 Hendron Rd
- 7474 Groveport Rd
- 5398 Armour Ct
- 4875 S Hamilton Rd
- 4822 Elmont Place
- 3348 Glasgow Dr
- 564 Tallman St
- 139 Harbinger Dr
- 570 Tallman St
- 559 Tallman St
- 555 Tallman St
- 559 Harbinger Ct
- 551 Tallman St
- 563 Tallman St
- 574 Tallman St
- 555 Harbinger Ct
- 547 Tallman St
- 551 Harbinger Ct
- 578 Tallman St
- 0 Harbinger Dr
- 140 Harbinger Dr
- 563 Harbinger Ct
- 543 Tallman St
- 582 Tallman St
- 150 Harbinger Dr
- 240 Harbinger Ct