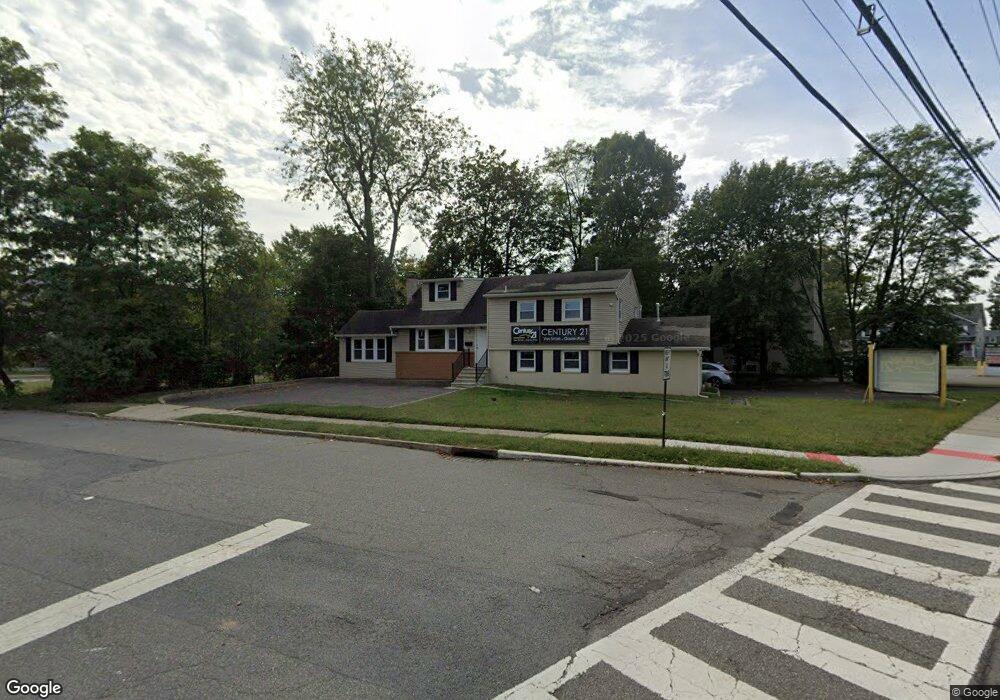
560 Union Ave Middlesex, NJ 08846
Estimated Value: $463,561
Studio
--
Bath
2,512
Sq Ft
$185/Sq Ft
Est. Value
About This Home
This home is located at 560 Union Ave, Middlesex, NJ 08846 and is currently estimated at $463,561, approximately $184 per square foot. 560 Union Ave is a home located in Middlesex County with nearby schools including Middlesex High School and Our Lady of Mount Virgin School.
Ownership History
Date
Name
Owned For
Owner Type
Purchase Details
Closed on
Aug 16, 2024
Sold by
Ping Real Estate Llc
Bought by
Ping 560 Llc
Current Estimated Value
Purchase Details
Closed on
Aug 10, 2023
Sold by
Gulla Middlesex Realty Llc
Bought by
Ping Real Estate Llc
Purchase Details
Closed on
Mar 31, 2003
Create a Home Valuation Report for This Property
The Home Valuation Report is an in-depth analysis detailing your home's value as well as a comparison with similar homes in the area
Home Values in the Area
Average Home Value in this Area
Purchase History
| Date | Buyer | Sale Price | Title Company |
|---|---|---|---|
| Ping 560 Llc | -- | None Listed On Document | |
| Ping 560 Llc | -- | None Listed On Document | |
| Ping Real Estate Llc | $350,000 | Stewart Title | |
| -- | -- | -- |
Source: Public Records
Tax History
| Year | Tax Paid | Tax Assessment Tax Assessment Total Assessment is a certain percentage of the fair market value that is determined by local assessors to be the total taxable value of land and additions on the property. | Land | Improvement |
|---|---|---|---|---|
| 2025 | $8,719 | $433,300 | $200,000 | $233,300 |
| 2024 | $8,301 | $376,800 | $200,000 | $176,800 |
Source: Public Records
Map
Nearby Homes
- 101 Lorraine Ave
- 241 Cook Ave
- 310 Howard Ave
- 212 Vesper Ave
- 533 Edgeworth St
- 52 Greenbrook Rd
- 57 Greenbrook Rd
- 531 Harris Ave
- 7 Weiss Dr
- 407 Clinton Ave
- 116 Greene Ave
- 643 Drake Ave
- 8 Juniper Pointe Trail
- 303 Ashland Rd
- 1108 Shadowlawn Dr Unit 701
- 1108 Shadowlawn Dr
- 3038 King Ct
- 123 3rd St
- 1055 Shadowlawn Dr
- 531 Chestnut St
Your Personal Tour Guide
Ask me questions while you tour the home.