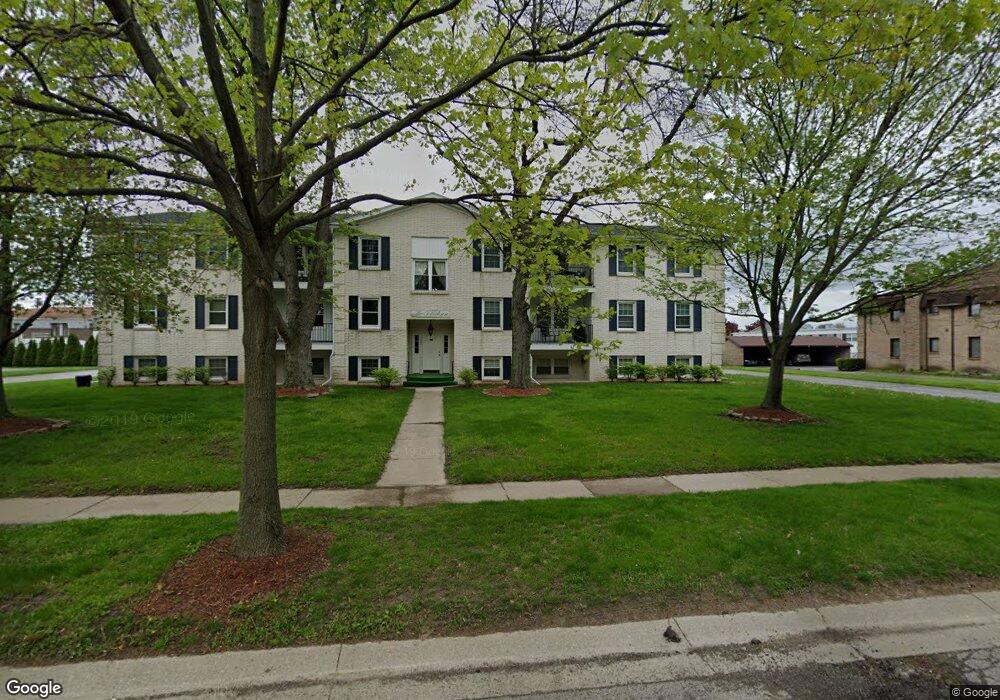
5600 Cresthaven Ln Unit 31 Toledo, OH 43614
Southwyck NeighborhoodEstimated Value: $79,741 - $108,000
2
Beds
1
Bath
979
Sq Ft
$94/Sq Ft
Est. Value
About This Home
This home is located at 5600 Cresthaven Ln Unit 31, Toledo, OH 43614 and is currently estimated at $91,685, approximately $93 per square foot. 5600 Cresthaven Ln Unit 31 is a home located in Lucas County with nearby schools including Glendale-Feilbach Elementary School, Bowsher High School, and Northwest Ohio Classical Academy.
Ownership History
Date
Name
Owned For
Owner Type
Purchase Details
Closed on
Jul 14, 2014
Sold by
Mossing Joseph M and Mossing Sherri L
Bought by
Mossing Joseph M and The Joseph M Mossing Trust
Current Estimated Value
Purchase Details
Closed on
Nov 26, 2012
Sold by
Fannie Mae
Bought by
Mossing Joseph
Purchase Details
Closed on
Jul 25, 2012
Sold by
Miller Marcy G
Bought by
Federal National Mortgage Association
Purchase Details
Closed on
Sep 12, 2003
Sold by
Lutz Roswell E and Lutz Jeanette H
Bought by
Miller Marcy G
Home Financials for this Owner
Home Financials are based on the most recent Mortgage that was taken out on this home.
Original Mortgage
$72,600
Interest Rate
6.33%
Mortgage Type
Purchase Money Mortgage
Purchase Details
Closed on
May 28, 1996
Sold by
Robinson Sandra
Bought by
Lutz Rosewell E and Lutz Jeanette H
Purchase Details
Closed on
Nov 27, 1991
Sold by
Robinson Victor
Purchase Details
Closed on
Jun 3, 1988
Sold by
Kenny Patrick T
Create a Home Valuation Report for This Property
The Home Valuation Report is an in-depth analysis detailing your home's value as well as a comparison with similar homes in the area
Home Values in the Area
Average Home Value in this Area
Purchase History
| Date | Buyer | Sale Price | Title Company |
|---|---|---|---|
| Mossing Joseph M | -- | None Available | |
| Mossing Joseph | $22,300 | Nova Title Agency Inc | |
| Federal National Mortgage Association | $20,000 | None Available | |
| Miller Marcy G | $76,500 | Mta | |
| Lutz Rosewell E | $43,900 | -- | |
| -- | -- | -- | |
| -- | $47,000 | -- |
Source: Public Records
Mortgage History
| Date | Status | Borrower | Loan Amount |
|---|---|---|---|
| Previous Owner | Miller Marcy G | $72,600 |
Source: Public Records
Tax History
| Year | Tax Paid | Tax Assessment Tax Assessment Total Assessment is a certain percentage of the fair market value that is determined by local assessors to be the total taxable value of land and additions on the property. | Land | Improvement |
|---|---|---|---|---|
| 2025 | -- | $21,735 | $2,940 | $18,795 |
| 2024 | $658 | $21,735 | $2,940 | $18,795 |
| 2023 | $1,261 | $14,665 | $2,275 | $12,390 |
| 2022 | $936 | $14,665 | $2,275 | $12,390 |
| 2021 | $963 | $14,665 | $2,275 | $12,390 |
| 2020 | $893 | $12,075 | $2,765 | $9,310 |
| 2019 | $874 | $12,075 | $2,765 | $9,310 |
| 2018 | $980 | $12,075 | $2,765 | $9,310 |
| 2017 | $1,112 | $14,700 | $2,135 | $12,565 |
| 2016 | $1,100 | $42,000 | $6,100 | $35,900 |
| 2015 | $1,088 | $42,000 | $6,100 | $35,900 |
| 2014 | $951 | $18,210 | $2,140 | $16,070 |
| 2013 | $1,177 | $18,210 | $2,140 | $16,070 |
Source: Public Records
Map
Nearby Homes
- 5637 Swan Creek Dr
- 2161 Winterset Dr Unit 2161
- 5441 Cresthaven Ln
- 5741 Heatherbank Rd
- 1662 Brownstone Blvd Unit 312
- 1662 Brownstone Blvd
- 1668 Brownstone Blvd
- 1660 Brownstone Blvd Unit 213
- 1666 Brownstone Blvd
- 1562 Saddlebrook Ct Unit B
- 2437 Knights Hill Ln
- 2311 Maryann Place
- 1936 W Crest Dr
- 2585 W Village Dr
- 5721 Bernath Ct Unit GL
- 5665 Bernath Ct
- 5662 Bernath Ct Unit E
- 4730 Glendale Ave
- 4671 Valley Ridge Ct
- 1819 Garden Ridge Dr
- 5600 Cresthaven Ln Unit 24
- 5600 Cresthaven Ln Unit 22
- 5600 Cresthaven Ln
- 5600 Cresthaven Ln Unit 12
- 5600 Cresthaven Ln Unit 11
- 5600 Cresthaven Ln Unit 34
- 5600 Cresthaven Ln Unit 33
- 5600 Cresthaven Ln Unit 23
- 5600 Cresthaven Ln Unit 21
- 5600 Cresthaven Ln Unit 14
- 5600 Cresthaven Ln Unit 32
- 5600 Cresthaven Ln Unit 13
- 5560 Cresthaven Ln
- 5618 Cresthaven Ln
- 5620 Cresthaven Ln
- 5515 Southwyck Blvd
- 5624 Cresthaven Ln
- 5552 Cresthaven Ln
- 5533 Southwyck Blvd
- 5533 Southwyck Blvd
Your Personal Tour Guide
Ask me questions while you tour the home.