Estimated payment $1,728/month
Highlights
- Deck
- Central Air
- Heating System Uses Propane
- No HOA
- 3 Car Garage
- Gas Fireplace
About This Home
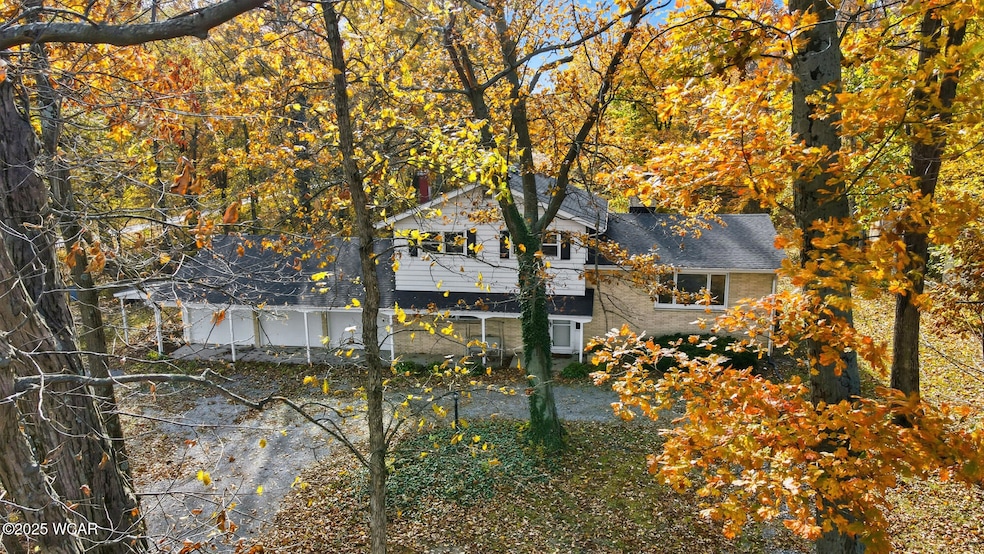
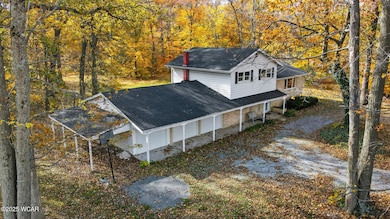
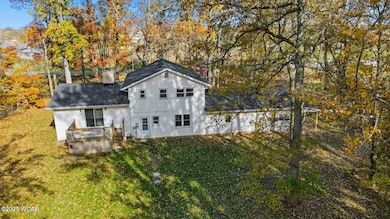
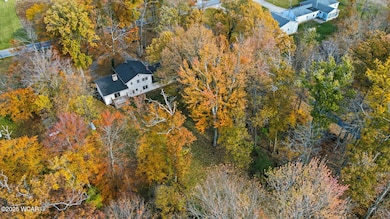
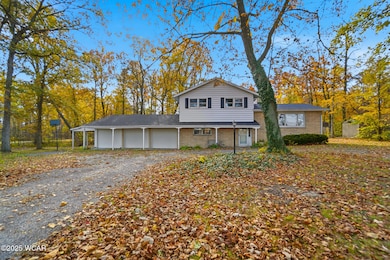
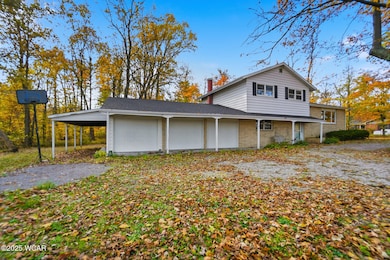
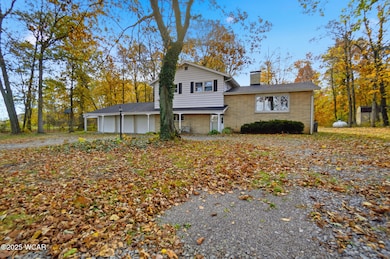
Beautifully renovated 3-bedroom, 2.5 bath home on 1.5 acres in Allen East Schools, Perry township. Every inch has been updated — new subfloors on main level and flooring throughout, all-new trim, outlets, and interior doors. The kitchen features brand-new cabinets, quartz countertops, and an undermount sink. All bathrooms include new vanities, sinks, and fixtures, with a fully tiled master shower and new hallway tub. Fresh paint, new lighting, and refurbished stairs add a modern touch. Major updates include new wiring, plumbing, water lines, vapor barrier, sump system, and 3'' stone crawl space base. New roof and gutters (2023), re-stoned driveway, and a 3-car garage complete this move-in-ready home. Don't miss this turnkey property combining quality updates and country charm!
Home Details
Home Type
- Single Family
Est. Annual Taxes
- $2,143
Year Built
- Built in 1968 | Remodeled
Parking
- 3 Car Garage
Home Design
- Block Foundation
Interior Spaces
- 1,846 Sq Ft Home
- 2-Story Property
- Gas Fireplace
- Unfinished Basement
Bedrooms and Bathrooms
- 3 Bedrooms
Utilities
- Central Air
- Heating System Uses Propane
- Septic Tank
Additional Features
- Deck
- 1.5 Acre Lot
Community Details
- No Home Owners Association
Listing and Financial Details
- Assessor Parcel Number 47-1300-01-004.000
Map
Tax History
| Year | Tax Paid | Tax Assessment Tax Assessment Total Assessment is a certain percentage of the fair market value that is determined by local assessors to be the total taxable value of land and additions on the property. | Land | Improvement |
|---|---|---|---|---|
| 2024 | $2,166 | $59,400 | $7,950 | $51,450 |
| 2023 | $2,073 | $49,500 | $6,620 | $42,880 |
| 2022 | $2,093 | $49,500 | $6,620 | $42,880 |
| 2021 | $2,084 | $49,500 | $6,620 | $42,880 |
| 2020 | $1,863 | $42,950 | $5,950 | $37,000 |
| 2019 | $1,863 | $42,950 | $5,950 | $37,000 |
| 2018 | $1,864 | $42,950 | $5,950 | $37,000 |
| 2017 | $1,752 | $39,730 | $5,950 | $33,780 |
| 2016 | $1,762 | $39,730 | $5,950 | $33,780 |
| 2015 | $1,821 | $39,730 | $5,950 | $33,780 |
| 2014 | $1,821 | $39,590 | $5,950 | $33,640 |
| 2013 | $1,837 | $39,590 | $5,950 | $33,640 |
Property History
| Date | Event | Price | List to Sale | Price per Sq Ft |
|---|---|---|---|---|
| 02/21/2026 02/21/26 | Pending | -- | -- | -- |
| 02/13/2026 02/13/26 | Price Changed | $289,900 | -1.7% | $157 / Sq Ft |
| 01/08/2026 01/08/26 | Price Changed | $294,900 | -1.7% | $160 / Sq Ft |
| 12/05/2025 12/05/25 | For Sale | $299,900 | 0.0% | $162 / Sq Ft |
| 11/16/2025 11/16/25 | Pending | -- | -- | -- |
| 11/10/2025 11/10/25 | For Sale | $299,900 | -- | $162 / Sq Ft |
Purchase History
| Date | Type | Sale Price | Title Company |
|---|---|---|---|
| Warranty Deed | $166,000 | -- | |
| Certificate Of Transfer | -- | None Available | |
| Warranty Deed | $128,000 | None Available | |
| Deed | $48,500 | -- |
Mortgage History
| Date | Status | Loan Amount | Loan Type |
|---|---|---|---|
| Open | $157,700 | New Conventional | |
| Previous Owner | $128,000 | Assumption |
Source: West Central Association of REALTORS® (OH)
MLS Number: 308792
APN: 47-13-00-01-004.000
- 5490 E Hanthorn Rd
- 6381 McPheron Rd
- 1855 S Cool Rd
- 4160 E Hanthorn Rd
- 7165 Faulkner Rd
- 3300 Johnston Rd
- 4786 Harding Hwy
- 304 Pinewood Cir
- 3833 Harding Hwy
- 591 Lakeridge Dr
- 32 Lakeside Dr
- 3774 Mount Vernon Place Unit C
- 485 S Mumaugh Rd
- 4850 Bowdle Rd
- 3746 Armstead Place
- 0 Harding Hwy Unit 307187
- 0 Harding Hwy Unit 19317256
- 2525 Harding Hwy
- 2500 Greely Chapel Rd
- 314 Devonshire Dr

Ask me questions while you tour the home.