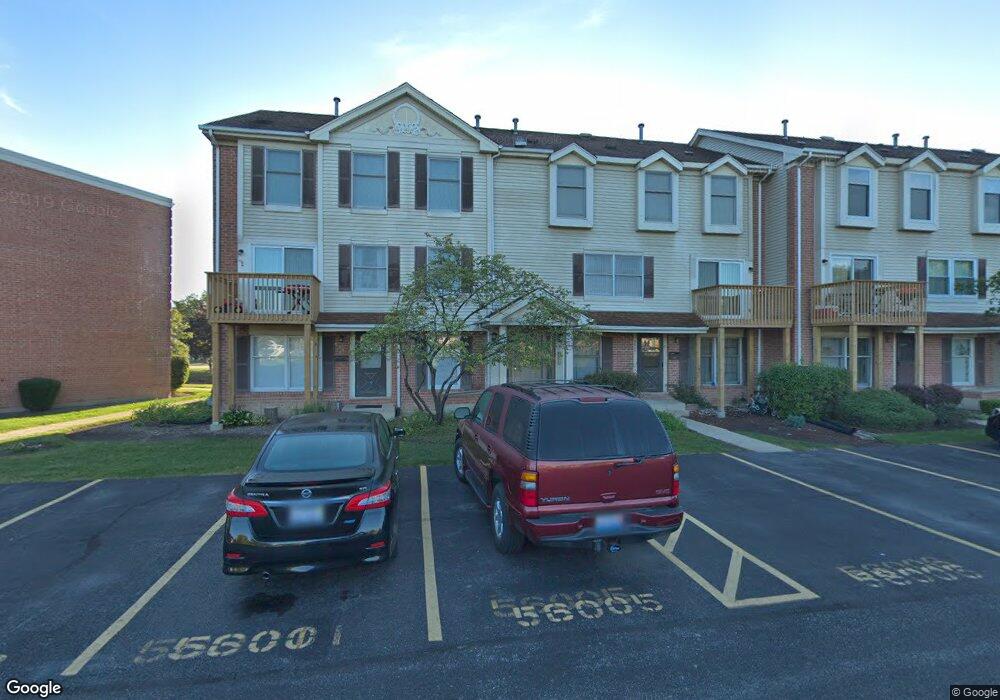
5600 Tinder Unit 56001 Rolling Meadows, IL 60008
Busse Woods NeighborhoodEstimated Value: $220,977 - $258,000
2
Beds
--
Bath
7,200
Sq Ft
$33/Sq Ft
Est. Value
About This Home
This home is located at 5600 Tinder Unit 56001, Rolling Meadows, IL 60008 and is currently estimated at $240,744, approximately $33 per square foot. 5600 Tinder Unit 56001 is a home located in Cook County with nearby schools including Willow Bend Elementary School, Carl Sandburg Junior High School, and Rolling Meadows High School.
Ownership History
Date
Name
Owned For
Owner Type
Purchase Details
Closed on
Dec 5, 2001
Sold by
Wojtas Leszek
Bought by
Chagoya Lorenzo
Current Estimated Value
Home Financials for this Owner
Home Financials are based on the most recent Mortgage that was taken out on this home.
Original Mortgage
$128,700
Outstanding Balance
$48,502
Interest Rate
6.53%
Mortgage Type
FHA
Estimated Equity
$192,242
Purchase Details
Closed on
Mar 27, 1999
Sold by
Wywiorka Andrzej W and Wywiorka Bozena
Bought by
Wojtas Leszek and Wojtas Dagmara
Home Financials for this Owner
Home Financials are based on the most recent Mortgage that was taken out on this home.
Original Mortgage
$104,400
Interest Rate
6.92%
Mortgage Type
Balloon
Purchase Details
Closed on
Sep 30, 1994
Sold by
Brady Nick M and Brady Catherine M
Bought by
Wywiorka Andrzej W and Wywiorka Bozena
Home Financials for this Owner
Home Financials are based on the most recent Mortgage that was taken out on this home.
Original Mortgage
$95,100
Interest Rate
8.64%
Mortgage Type
FHA
Create a Home Valuation Report for This Property
The Home Valuation Report is an in-depth analysis detailing your home's value as well as a comparison with similar homes in the area
Home Values in the Area
Average Home Value in this Area
Purchase History
| Date | Buyer | Sale Price | Title Company |
|---|---|---|---|
| Chagoya Lorenzo | $143,000 | Marquis Title | |
| Wojtas Leszek | $116,000 | -- | |
| Wywiorka Andrzej W | $100,500 | Republic Title Company |
Source: Public Records
Mortgage History
| Date | Status | Borrower | Loan Amount |
|---|---|---|---|
| Open | Chagoya Lorenzo | $128,700 | |
| Previous Owner | Wojtas Leszek | $104,400 | |
| Previous Owner | Wywiorka Andrzej W | $95,100 |
Source: Public Records
Tax History
| Year | Tax Paid | Tax Assessment Tax Assessment Total Assessment is a certain percentage of the fair market value that is determined by local assessors to be the total taxable value of land and additions on the property. | Land | Improvement |
|---|---|---|---|---|
| 2025 | $4,308 | $20,913 | $1,427 | $19,486 |
| 2024 | $4,308 | $17,424 | $1,202 | $16,222 |
| 2023 | $4,091 | $17,424 | $1,202 | $16,222 |
| 2022 | $4,091 | $17,424 | $1,202 | $16,222 |
| 2021 | $2,123 | $9,775 | $788 | $8,987 |
| 2020 | $2,146 | $9,775 | $788 | $8,987 |
| 2019 | $2,178 | $10,956 | $788 | $10,168 |
| 2018 | $2,814 | $12,162 | $676 | $11,486 |
| 2017 | $2,775 | $12,162 | $676 | $11,486 |
| 2016 | $2,843 | $12,162 | $676 | $11,486 |
| 2015 | $1,899 | $8,686 | $600 | $8,086 |
| 2014 | $1,871 | $8,686 | $600 | $8,086 |
| 2013 | $1,808 | $8,686 | $600 | $8,086 |
Source: Public Records
Map
Nearby Homes
- 5450 Astor Ln Unit 104
- 5450 Astor Ln Unit 415
- 5400 Astor Ln Unit 116
- 1418 S Princeton Ave
- 1322 S New Wilke Rd Unit 1C
- 1615 S Harvard Ave
- 1302 S Princeton Ave
- 1227 S Old Wilke Rd Unit 306
- 1107 W White Oak St
- 914 W Noyes St
- 2504 Algonquin Rd Unit 14
- 5201 Carriageway Dr Unit C317
- 2508 Algonquin Rd Unit 16
- 1126 S New Wilke Rd Unit 307
- 5000 Carriageway Dr Unit 211
- 5101 Carriageway Dr Unit 201
- 1117 S Old Wilke Rd Unit 206
- 5001 Carriage Way Dr Unit 116
- 1107 S Old Wilke Rd Unit 103
- 1107 S Old Wilke Rd Unit 208
- 5600 Tinder Unit 56003
- 5600 Tinder Unit 56002
- 5600 Tinder Unit 56004
- 5600 Tinder Unit 56005
- 5600 Tinder Unit 56006
- 5600 Tinder Unit 2
- 5600 Tinder Unit 5
- 5600 Tinder Unit 3
- 5602 Tinder Unit 56026
- 5604 Tinder Unit 56045
- 5602 Tinder Unit 56024
- 5602 Tinder Unit 56025
- 5602 Tinder Unit 56023
- 5602 Tinder Unit 56022
- 5604 Tinder Unit 56042
- 5604 Tinder Unit 56043
- 5604 Tinder Unit 56046
- 5604 Tinder Unit 56041
- 5602 Tinder Unit 56021
- 5604 Tinder Unit 56044
Your Personal Tour Guide
Ask me questions while you tour the home.