5601 Cape Coral Cir Unit 1 Las Vegas, NV 89130
North Cheyenne NeighborhoodEstimated Value: $389,000 - $495,000
3
Beds
2
Baths
2,007
Sq Ft
$232/Sq Ft
Est. Value
About This Home
This home is located at 5601 Cape Coral Cir Unit 1, Las Vegas, NV 89130 and is currently estimated at $466,323, approximately $232 per square foot. 5601 Cape Coral Cir Unit 1 is a home located in Clark County with nearby schools including Ernest May Elementary School, Theron L Swainston Middle School, and Shadow Ridge High School.
Ownership History
Date
Name
Owned For
Owner Type
Purchase Details
Closed on
Oct 11, 2013
Sold by
Fara George and Fara Liuba
Bought by
Fara Liuba
Current Estimated Value
Purchase Details
Closed on
Feb 17, 2011
Sold by
Hsbc Bank Usa National Association
Bought by
Fara George and Fara Liuba
Purchase Details
Closed on
Sep 22, 2010
Sold by
Rimkus Wayne M and Rimkus Marcella L
Bought by
Hsbc Bank Usa National Association
Purchase Details
Closed on
Feb 17, 2003
Sold by
Family Trust Wayne M & Marcella L Rimkus
Bought by
Rimkus Wayne M and Rimkus Marcella L
Purchase Details
Closed on
Dec 3, 1993
Sold by
Hagerman John and Hagerman Carol Ware
Bought by
Rimkus Wayne M and Rimkus Marcella L
Home Financials for this Owner
Home Financials are based on the most recent Mortgage that was taken out on this home.
Original Mortgage
$45,000
Interest Rate
6.74%
Create a Home Valuation Report for This Property
The Home Valuation Report is an in-depth analysis detailing your home's value as well as a comparison with similar homes in the area
Home Values in the Area
Average Home Value in this Area
Purchase History
| Date | Buyer | Sale Price | Title Company |
|---|---|---|---|
| Fara Liuba | -- | None Available | |
| Fara George | $96,500 | Chicago Title Las Vegas | |
| Hsbc Bank Usa National Association | $153,000 | Accommodation | |
| Rimkus Wayne M | -- | -- | |
| Rimkus Wayne M | $180,000 | United Title |
Source: Public Records
Mortgage History
| Date | Status | Borrower | Loan Amount |
|---|---|---|---|
| Previous Owner | Rimkus Wayne M | $45,000 |
Source: Public Records
Tax History Compared to Growth
Tax History
| Year | Tax Paid | Tax Assessment Tax Assessment Total Assessment is a certain percentage of the fair market value that is determined by local assessors to be the total taxable value of land and additions on the property. | Land | Improvement |
|---|---|---|---|---|
| 2025 | $2,176 | $108,049 | $41,160 | $66,889 |
| 2024 | $2,114 | $108,049 | $41,160 | $66,889 |
| 2023 | $2,114 | $105,654 | $42,000 | $63,654 |
| 2022 | $2,052 | $91,581 | $32,760 | $58,821 |
| 2021 | $1,992 | $85,901 | $29,400 | $56,501 |
| 2020 | $1,931 | $84,407 | $28,140 | $56,267 |
| 2019 | $1,875 | $80,467 | $24,780 | $55,687 |
| 2018 | $1,821 | $75,629 | $21,420 | $54,209 |
| 2017 | $2,434 | $74,234 | $18,900 | $55,334 |
| 2016 | $1,725 | $68,138 | $15,750 | $52,388 |
| 2015 | $1,721 | $61,455 | $12,250 | $49,205 |
| 2014 | $1,670 | $49,435 | $12,250 | $37,185 |
Source: Public Records
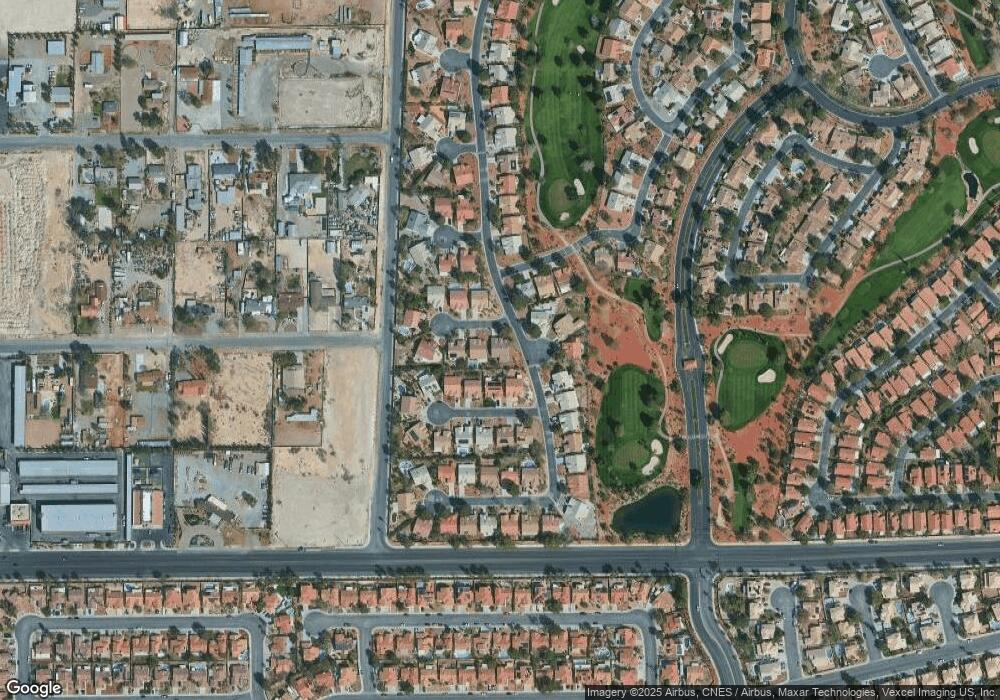
Map
Nearby Homes
- 5605 Bay Shore Cir
- 4905 Ocean Shores Way
- 4821 Fiesta Lakes St
- 4801 Fiesta Lakes St
- 5600 Segolilly Cir
- 5004 Rancho Bernardo Way
- 4833 Fiesta Lakes St
- 4816 Fiesta Lakes St
- 4808 Fiesta Lakes St
- 4817 Friar Ln
- 5213 Tamanar Dr
- 4708 Royal Sunset Ct
- 4872 Maryvale Dr
- 5900 Red Umber Ave
- 4852 Maryvale Dr
- 5812 Ventana Dr
- 4933 Fiesta Lakes St
- 5213 Red Glory Dr
- 6105 Sadler Dr
- 4708 English Ivy Ct
- 5605 Cape Coral Cir
- 5608 Ocean Pines Cir
- 5612 Ocean Pines Cir
- 5609 Cape Coral Cir
- 5596 Edisto Cir
- 5604 Cape Coral Cir
- 5616 Ocean Pines Cir
- 4900 Rancho Bernardo Way
- 5597 Edisto Cir
- 5593 Edisto Cir
- 5608 Cape Coral Cir
- 5592 Edisto Cir
- 4904 Rancho Bernardo Way
- 4820 Linkside Dr
- 5613 Cape Coral Cir
- 5605 Ocean Pines Cir
- 5620 Ocean Pines Cir
- 5609 Ocean Pines Cir
- 5601 Ocean Pines Cir
- 5613 Ocean Pines Cir