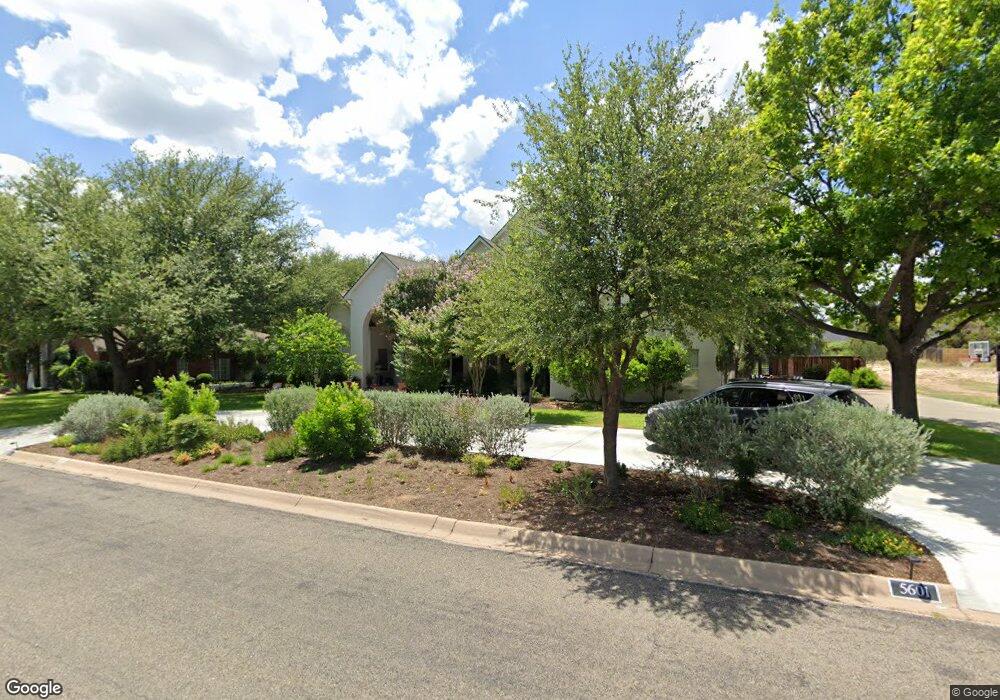
5601 Columbine Ln San Angelo, TX 76904
Bentwood Country Club Estates NeighborhoodEstimated Value: $711,125 - $831,000
--
Bed
--
Bath
3,812
Sq Ft
$202/Sq Ft
Est. Value
About This Home
This home is located at 5601 Columbine Ln, San Angelo, TX 76904 and is currently estimated at $769,531, approximately $201 per square foot. 5601 Columbine Ln is a home located in Tom Green County with nearby schools including Lamar Elementary School, Glenn Middle School, and Central High School.
Ownership History
Date
Name
Owned For
Owner Type
Purchase Details
Closed on
Jun 15, 2016
Sold by
Brannan Timothy Barton
Bought by
Brannan Holly Diana
Current Estimated Value
Purchase Details
Closed on
Feb 21, 2014
Sold by
Brannan Leo and Brannan Sara
Bought by
Brannan Tim
Purchase Details
Closed on
Aug 30, 2013
Sold by
Rsh Trust I and Heinze Robert Alvin
Bought by
Brannan Timothy Barton
Home Financials for this Owner
Home Financials are based on the most recent Mortgage that was taken out on this home.
Original Mortgage
$364,500
Outstanding Balance
$90,634
Interest Rate
4.36%
Mortgage Type
New Conventional
Estimated Equity
$678,897
Purchase Details
Closed on
Oct 27, 1997
Sold by
Heinze Robert A and Heinze Sherlene S
Bought by
Brannan Holly Diana
Purchase Details
Closed on
Mar 16, 1995
Sold by
Shamrock Services Inc % Trustees
Bought by
Brannan Holly Diana
Create a Home Valuation Report for This Property
The Home Valuation Report is an in-depth analysis detailing your home's value as well as a comparison with similar homes in the area
Home Values in the Area
Average Home Value in this Area
Purchase History
| Date | Buyer | Sale Price | Title Company |
|---|---|---|---|
| Brannan Holly Diana | -- | None Available | |
| Brannan Tim | -- | None Available | |
| Brannan Timothy Barton | -- | None Available | |
| Brannan Holly Diana | -- | -- | |
| Brannan Holly Diana | -- | -- |
Source: Public Records
Mortgage History
| Date | Status | Borrower | Loan Amount |
|---|---|---|---|
| Open | Brannan Timothy Barton | $364,500 |
Source: Public Records
Tax History Compared to Growth
Tax History
| Year | Tax Paid | Tax Assessment Tax Assessment Total Assessment is a certain percentage of the fair market value that is determined by local assessors to be the total taxable value of land and additions on the property. | Land | Improvement |
|---|---|---|---|---|
| 2025 | $11,233 | $687,209 | $100,920 | $586,289 |
| 2024 | $9,893 | $682,360 | $91,740 | $590,620 |
| 2023 | $8,920 | $692,520 | $94,710 | $597,810 |
| 2022 | $10,465 | $627,540 | $68,860 | $558,680 |
| 2021 | $10,409 | $429,360 | $0 | $0 |
| 2020 | $10,550 | $429,360 | $68,860 | $360,500 |
| 2019 | $10,867 | $429,360 | $68,860 | $360,500 |
| 2018 | $10,735 | $425,830 | $68,860 | $356,970 |
| 2017 | $10,642 | $424,240 | $68,860 | $355,380 |
| 2016 | $10,566 | $424,240 | $68,860 | $355,380 |
| 2015 | $8,367 | $382,900 | $22,800 | $360,100 |
| 2014 | $7,888 | $351,040 | $22,800 | $328,240 |
| 2013 | $4,525 | $328,700 | $0 | $0 |
Source: Public Records
Map
Nearby Homes
- 5605 Columbine Ln
- 5606 Imperial Ct
- 1737 Overhill Dr Unit 27
- 1733 Overhill Dr
- 5510 Enclave Ct
- 1958 Beaty Rd
- 1938 Beaty Rd
- 5441 Riviera Ln
- 1905 Beaty Rd
- 5425 Riviera Ln
- 1911 Beaty Rd Unit 27
- 2016 Beaty Cir
- 5417 Bent Oak Ct
- 2009 Pebble Beach Ct
- 5234 Beverly Dr
- 2061 Beaty Rd
- 5313 Enclave Ct
- 5214 N Bentwood Dr
- 00 Other
- 5202 Beverly Dr
- 5606 Grey Charles Ct
- 5517 Columbine Ln
- 5609 Columbine Ln
- 5602 Columbine Ln
- 5606 Columbine Ln
- 0 Columbine Ln Unit 91155
- 0 Columbine Ln Unit 25 109625
- 5610 Grey Charles Ct
- 5530 Turnberry Ct
- 5610 Columbine Ln
- 5522 Columbine Ln
- 5602 Grey Charles Ct
- 5721 Columbine Ln Unit 2.020
- 5513 Columbine Ln
- 5534 Woodbine Ln
- 5518 Columbine Ln
- 5613 Columbine Ln
- 5614 Grey Charles Ct
- 5614 Columbine Ln
- 5514 Columbine Ln