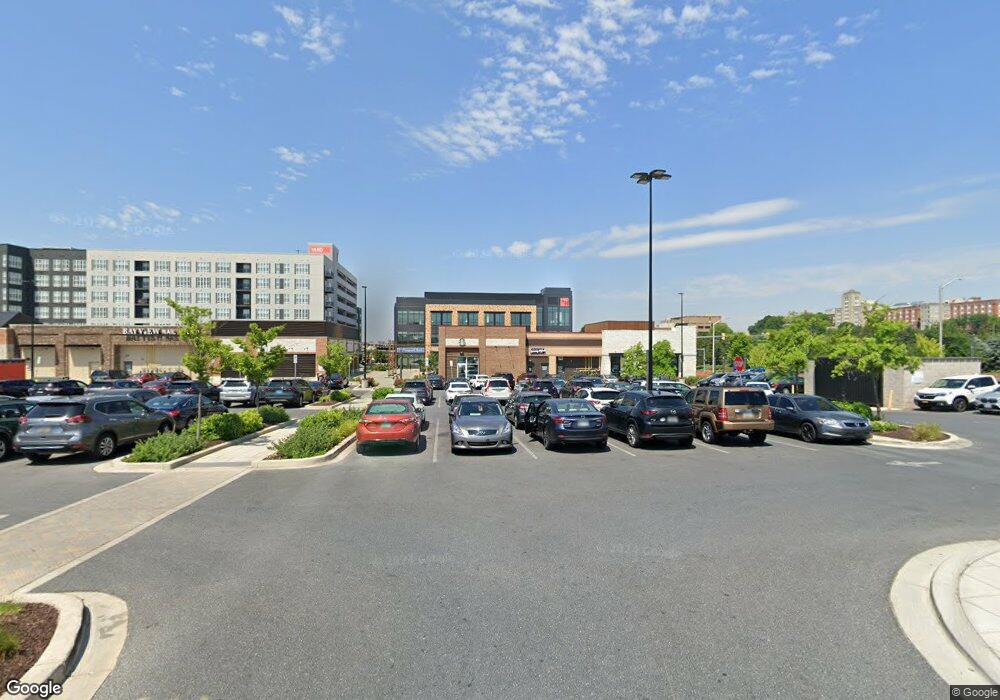
5601 Eastern Ave Baltimore, MD 21224
--
Bed
--
Bath
88,579
Sq Ft
7.2
Acres
About This Home
This home is located at 5601 Eastern Ave, Baltimore, MD 21224. 5601 Eastern Ave is a home located in Baltimore City with nearby schools including Graceland Park-O'Donnell Heights Elementary/Middle School, Booker T. Washington Middle School, and Patterson High School.
Ownership History
Date
Name
Owned For
Owner Type
Purchase Details
Closed on
Dec 31, 2018
Sold by
Mcb 5801 Eastern Llc
Bought by
Mcb Y56 Retail Llc
Home Financials for this Owner
Home Financials are based on the most recent Mortgage that was taken out on this home.
Original Mortgage
$6,720,000
Outstanding Balance
$5,931,992
Interest Rate
4.8%
Mortgage Type
Commercial
Purchase Details
Closed on
Apr 7, 2014
Sold by
Pemco Corporation
Bought by
Trp Mcb 5601 Eastern Llc
Purchase Details
Closed on
Oct 2, 1997
Sold by
Miles Inc
Bought by
Pemco Holding Corp
Create a Home Valuation Report for This Property
The Home Valuation Report is an in-depth analysis detailing your home's value as well as a comparison with similar homes in the area
Home Values in the Area
Average Home Value in this Area
Purchase History
| Date | Buyer | Sale Price | Title Company |
|---|---|---|---|
| Mcb Y56 Retail Llc | $5,959,875 | None Available | |
| Trp Mcb 5601 Eastern Llc | $3,000,000 | Multiple | |
| Pemco Holding Corp | $2,400,000 | -- |
Source: Public Records
Mortgage History
| Date | Status | Borrower | Loan Amount |
|---|---|---|---|
| Open | Mcb Y56 Retail Llc | $6,720,000 |
Source: Public Records
Tax History Compared to Growth
Tax History
| Year | Tax Paid | Tax Assessment Tax Assessment Total Assessment is a certain percentage of the fair market value that is determined by local assessors to be the total taxable value of land and additions on the property. | Land | Improvement |
|---|---|---|---|---|
| 2025 | $54,242 | $20,592,500 | $3,598,500 | $16,994,000 |
| 2024 | $54,242 | $20,592,500 | $3,598,500 | $16,994,000 |
| 2023 | $54,242 | $20,592,500 | $3,598,500 | $16,994,000 |
| 2022 | $132,249 | $22,050,600 | $467,800 | $21,582,800 |
| 2021 | $504,197 | $21,364,300 | $0 | $0 |
| 2020 | $124,541 | $20,678,000 | $0 | $0 |
| 2019 | $30,492 | $467,800 | $467,800 | $0 |
| 2018 | $75,852 | $3,214,067 | $0 | $0 |
| 2017 | $73,413 | $3,110,733 | $0 | $0 |
| 2016 | $72,000 | $3,007,400 | $0 | $0 |
| 2015 | $72,000 | $3,007,500 | $0 | $0 |
| 2014 | $72,000 | $3,007,500 | $0 | $0 |
Source: Public Records
Map
Nearby Homes