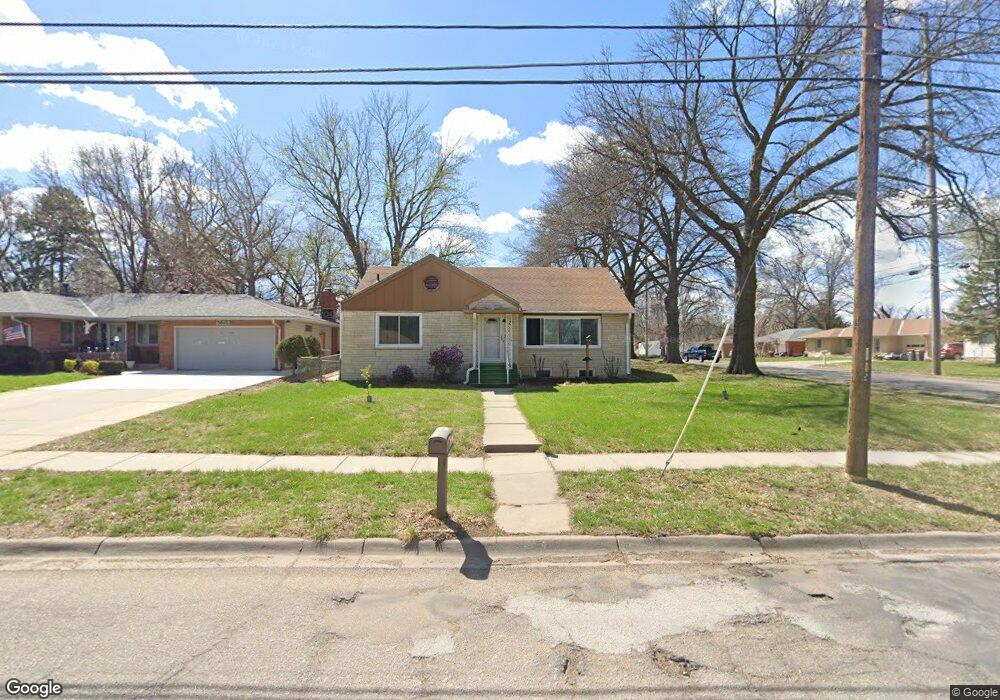
5601 L St Lincoln, NE 68510
Eastridge NeighborhoodEstimated Value: $296,921 - $310,000
2
Beds
2
Baths
2,633
Sq Ft
$116/Sq Ft
Est. Value
About This Home
This home is located at 5601 L St, Lincoln, NE 68510 and is currently estimated at $304,980, approximately $115 per square foot. 5601 L St is a home located in Lancaster County with nearby schools including Eastridge Elementary School, Lefler Middle School, and Lincoln East High School.
Ownership History
Date
Name
Owned For
Owner Type
Purchase Details
Closed on
Sep 17, 2009
Sold by
Leisy Alvin Bruce and Leisy Karol Ann
Bought by
Lesan Robert and Lesan Amy
Current Estimated Value
Home Financials for this Owner
Home Financials are based on the most recent Mortgage that was taken out on this home.
Original Mortgage
$133,536
Outstanding Balance
$87,376
Interest Rate
5.2%
Mortgage Type
FHA
Estimated Equity
$217,604
Purchase Details
Closed on
Sep 7, 1999
Sold by
Homolka Leo J
Bought by
Leisy Alvin Bruce and Leisy Karol Ann
Home Financials for this Owner
Home Financials are based on the most recent Mortgage that was taken out on this home.
Original Mortgage
$92,000
Interest Rate
10.5%
Create a Home Valuation Report for This Property
The Home Valuation Report is an in-depth analysis detailing your home's value as well as a comparison with similar homes in the area
Home Values in the Area
Average Home Value in this Area
Purchase History
| Date | Buyer | Sale Price | Title Company |
|---|---|---|---|
| Lesan Robert | $136,000 | Ct | |
| Leisy Alvin Bruce | $115,000 | -- |
Source: Public Records
Mortgage History
| Date | Status | Borrower | Loan Amount |
|---|---|---|---|
| Open | Lesan Robert | $133,536 | |
| Previous Owner | Leisy Alvin Bruce | $92,000 |
Source: Public Records
Tax History
| Year | Tax Paid | Tax Assessment Tax Assessment Total Assessment is a certain percentage of the fair market value that is determined by local assessors to be the total taxable value of land and additions on the property. | Land | Improvement |
|---|---|---|---|---|
| 2025 | $3,602 | $281,100 | $43,200 | $237,900 |
| 2024 | $3,602 | $260,600 | $36,000 | $224,600 |
| 2023 | $4,368 | $260,600 | $36,000 | $224,600 |
| 2022 | $4,293 | $215,400 | $31,500 | $183,900 |
| 2021 | $4,061 | $215,400 | $31,500 | $183,900 |
| 2020 | $3,183 | $166,600 | $31,500 | $135,100 |
| 2019 | $3,184 | $166,600 | $31,500 | $135,100 |
| 2018 | $2,791 | $145,400 | $31,500 | $113,900 |
| 2017 | $2,817 | $145,400 | $31,500 | $113,900 |
| 2016 | $2,738 | $140,600 | $31,500 | $109,100 |
| 2015 | $2,719 | $140,600 | $31,500 | $109,100 |
| 2014 | $2,548 | $131,000 | $31,500 | $99,500 |
| 2013 | -- | $131,000 | $31,500 | $99,500 |
Source: Public Records
Map
Nearby Homes
- 624 S 56th St
- 201 S 53rd St
- 728 Eastridge Dr
- 5843 Randolph St
- 5110 J St
- 5117 N St
- 940 S Cotner Blvd
- 929 S Cotner Blvd
- 933 Moraine Dr
- 610 S 48th St
- 368 S 47th St
- 84th Lexington St
- 854 S 48th St
- 540 N 58th St
- 335 S 46th St
- 421 Haverford Dr
- 706 Westminster Dr
- 930 Evergreen Dr
- 300 S 44th St
- 1401 S 58th St
Your Personal Tour Guide
Ask me questions while you tour the home.