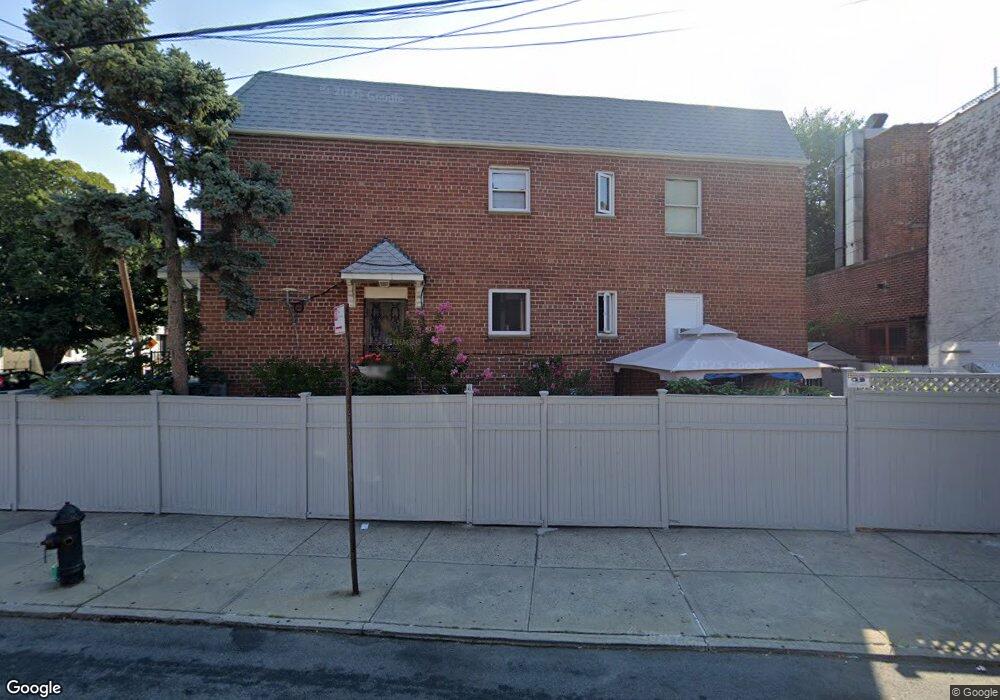
5602 62nd Ave Maspeth, NY 11378
Maspeth NeighborhoodEstimated Value: $867,992 - $1,091,000
--
Bed
--
Bath
2,255
Sq Ft
$451/Sq Ft
Est. Value
About This Home
This home is located at 5602 62nd Ave, Maspeth, NY 11378 and is currently estimated at $1,015,998, approximately $450 per square foot. 5602 62nd Ave is a home located in Queens County with nearby schools including I.S. 093 Ridgewood, Grover Cleveland High School, and Notre Dame Catholic Academy.
Ownership History
Date
Name
Owned For
Owner Type
Purchase Details
Closed on
Dec 29, 2003
Sold by
Vecchio Onofrio
Bought by
Bublea Haini and Bublea Ioan
Current Estimated Value
Home Financials for this Owner
Home Financials are based on the most recent Mortgage that was taken out on this home.
Original Mortgage
$400,000
Interest Rate
5.36%
Mortgage Type
Purchase Money Mortgage
Purchase Details
Closed on
Oct 21, 2003
Sold by
Fernandez Edward and Fernandez Lilian
Bought by
Vecchio Onofrio
Home Financials for this Owner
Home Financials are based on the most recent Mortgage that was taken out on this home.
Original Mortgage
$320,000
Interest Rate
5.88%
Mortgage Type
Purchase Money Mortgage
Purchase Details
Closed on
Mar 24, 1999
Sold by
Klosis Walter
Bought by
Fernandez Edward and Fernandez Lilian
Home Financials for this Owner
Home Financials are based on the most recent Mortgage that was taken out on this home.
Original Mortgage
$237,500
Interest Rate
6.95%
Create a Home Valuation Report for This Property
The Home Valuation Report is an in-depth analysis detailing your home's value as well as a comparison with similar homes in the area
Home Values in the Area
Average Home Value in this Area
Purchase History
| Date | Buyer | Sale Price | Title Company |
|---|---|---|---|
| Bublea Haini | $518,000 | -- | |
| Vecchio Onofrio | $467,000 | -- | |
| Fernandez Edward | $250,000 | Fidelity National Title Ins |
Source: Public Records
Mortgage History
| Date | Status | Borrower | Loan Amount |
|---|---|---|---|
| Previous Owner | Bublea Haini | $400,000 | |
| Previous Owner | Vecchio Onofrio | $320,000 | |
| Previous Owner | Fernandez Edward | $237,500 |
Source: Public Records
Tax History Compared to Growth
Tax History
| Year | Tax Paid | Tax Assessment Tax Assessment Total Assessment is a certain percentage of the fair market value that is determined by local assessors to be the total taxable value of land and additions on the property. | Land | Improvement |
|---|---|---|---|---|
| 2025 | $7,633 | $44,309 | $4,690 | $39,619 |
| 2024 | $3,539 | $41,803 | $4,637 | $37,166 |
| 2023 | $3,295 | $40,409 | $4,113 | $36,296 |
| 2022 | $3,374 | $61,380 | $7,500 | $53,880 |
| 2021 | $3,459 | $58,320 | $7,500 | $50,820 |
| 2020 | $7,157 | $61,860 | $7,500 | $54,360 |
| 2019 | $2,985 | $68,160 | $7,500 | $60,660 |
| 2018 | $2,773 | $33,674 | $4,646 | $29,028 |
| 2017 | $6,218 | $33,674 | $5,680 | $27,994 |
| 2016 | $5,899 | $33,674 | $5,680 | $27,994 |
| 2015 | $3,286 | $30,770 | $6,198 | $24,572 |
| 2014 | $3,286 | $29,030 | $6,670 | $22,360 |
Source: Public Records
Map
Nearby Homes
- 6167 56th St
- 6143 55th St
- 5631 Metropolitan Ave
- 55-01 Metropolitan Ave
- 5803 Metropolitan Ave
- 60-85 55th St
- 62-60 60th St
- 6077 55th St
- 6089 54th St
- 60-89 54th St
- 5368 Metropolitan Ave
- 21-17 Rene Ct
- 60-23 60th Rd
- 60-14 60th Ave
- 60-41 55th St
- 63-16 Forest Ave Unit 1B
- 6315 Forest Ave Unit 1A
- 2135 Menahan St
- 6058 60th Rd
- 5431 Nurge Ave
- 5604 62nd Ave
- 5606 62nd Ave
- 5608 62nd Ave
- 56 62 Nd Ave Unit 2
- 56-10 62nd Ave
- 56-10 62nd Ave
- 56-10 62nd Ave Unit 2
- 5610 62nd Ave
- 5605 Metropolitan Ave
- 56-05 Metropolitan Ave
- 8398 Metropolitan Ave
- 5612 62nd Ave
- 5613 Metropolitan Ave
- 56-13 Metropolitan Ave
- 61-73 56th St
- 61-73 56th St Unit 2nd Fl
- 5615 Metropolitan Ave
- 56-14 62nd Ave
- 5614 62nd Ave
- 5614 62nd Ave