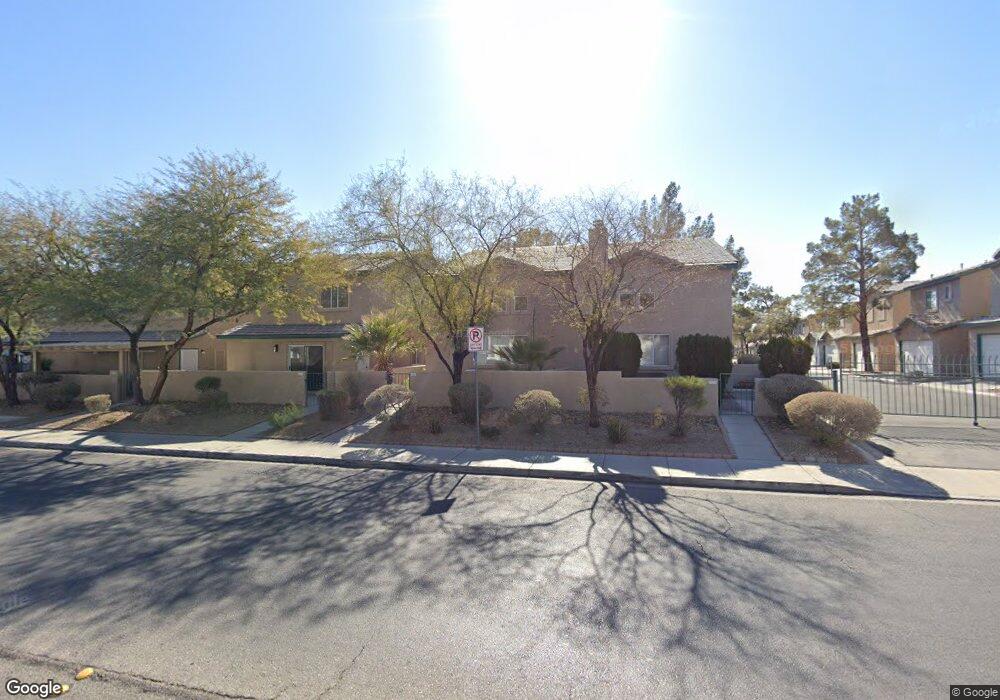
5602 Calais Ct Las Vegas, NV 89118
Estimated Value: $296,000 - $309,000
2
Beds
3
Baths
1,265
Sq Ft
$240/Sq Ft
Est. Value
About This Home
This home is located at 5602 Calais Ct, Las Vegas, NV 89118 and is currently estimated at $303,600, approximately $240 per square foot. 5602 Calais Ct is a home located in Clark County with nearby schools including Helen Jydstrup Elementary School, Grant Sawyer Middle School, and Durango High School.
Ownership History
Date
Name
Owned For
Owner Type
Purchase Details
Closed on
Jun 11, 2012
Sold by
Mays Steven A
Bought by
Treasurer Of Clark County
Current Estimated Value
Purchase Details
Closed on
Mar 30, 2000
Sold by
Benelli Ronald J and Benelli Priscilla R
Bought by
Mays Steven A
Home Financials for this Owner
Home Financials are based on the most recent Mortgage that was taken out on this home.
Original Mortgage
$80,000
Interest Rate
8.37%
Purchase Details
Closed on
Feb 18, 1999
Sold by
Benelli Ronald J and Benelli Priscilla R
Bought by
Benelli Ronald J and Bernelli Priscilla
Purchase Details
Closed on
Mar 19, 1998
Sold by
Benelli Ronald J and Benelli Priscilla R
Bought by
Benelli Ronald J and Benelli Priscilla R
Purchase Details
Closed on
Nov 4, 1993
Sold by
Chartered Realty Partners Iii
Bought by
Benelli Ronald J and Benelli Priscilla R
Home Financials for this Owner
Home Financials are based on the most recent Mortgage that was taken out on this home.
Original Mortgage
$50,000
Interest Rate
6.97%
Create a Home Valuation Report for This Property
The Home Valuation Report is an in-depth analysis detailing your home's value as well as a comparison with similar homes in the area
Home Values in the Area
Average Home Value in this Area
Purchase History
| Date | Buyer | Sale Price | Title Company |
|---|---|---|---|
| Treasurer Of Clark County | -- | None Available | |
| Mays Steven A | $104,500 | Land Title | |
| Benelli Ronald J | -- | -- | |
| Benelli Ronald J | -- | -- | |
| Benelli Ronald J | $90,000 | Stewart Title Of Nevada |
Source: Public Records
Mortgage History
| Date | Status | Borrower | Loan Amount |
|---|---|---|---|
| Previous Owner | Mays Steven A | $80,000 | |
| Previous Owner | Benelli Ronald J | $50,000 |
Source: Public Records
Tax History Compared to Growth
Tax History
| Year | Tax Paid | Tax Assessment Tax Assessment Total Assessment is a certain percentage of the fair market value that is determined by local assessors to be the total taxable value of land and additions on the property. | Land | Improvement |
|---|---|---|---|---|
| 2025 | $1,264 | $68,188 | $28,000 | $40,188 |
| 2024 | $1,171 | $68,188 | $28,000 | $40,188 |
| 2023 | $1,171 | $64,878 | $28,000 | $36,878 |
| 2022 | $1,084 | $56,189 | $21,000 | $35,189 |
| 2021 | $1,004 | $49,852 | $21,000 | $28,852 |
| 2020 | $930 | $49,498 | $19,250 | $30,248 |
| 2019 | $871 | $46,235 | $16,100 | $30,135 |
| 2018 | $831 | $41,186 | $12,250 | $28,936 |
| 2017 | $1,170 | $39,608 | $10,850 | $28,758 |
| 2016 | $779 | $38,104 | $9,450 | $28,654 |
| 2015 | $777 | $31,346 | $6,300 | $25,046 |
| 2014 | $753 | $26,559 | $5,250 | $21,309 |
Source: Public Records
Map
Nearby Homes
- 5617 Open Ct
- 5161 Lindell Rd Unit 206
- 5161 Lindell Rd Unit 201
- 5586 Lago Ct
- 5585 Lago Ct
- 5151 Lindell Rd Unit 103
- 5121 Lindell Rd Unit 206
- 5211 Lindell Rd Unit 103
- 5211 Lindell Rd Unit 207
- 5218 Pat Place
- 5237 Wave Dancer Ln
- 5261 Lindell Rd Unit 205
- 5221 Lindell Rd Unit 206
- 5251 Lindell Rd Unit 101
- 5266 Souvenir Ln
- 5273 Wave Dancer Ln
- 5165 Briar Meadow Way
- 5508 Ness Ave
- 5134 Briar Meadow Way
- 5771 Ritter Ln
- 5610 Calais Ct
- 5594 Calais Ct
- 5616 Calais Ct
- 5588 Calais Ct
- 5624 Calais Ct
- 5603 Open Ct
- 5611 Open Ct
- 5601 Calais Ct
- 5595 Open Ct
- 5609 Calais Ct
- 5609 Calais Ct Unit 1
- 5593 Calais Ct
- 5587 Calais Ct
- 5625 Open Ct
- 5623 Calais Ct
- 5161 Lindell Rd Unit 108
- 5161 Lindell Rd Unit 103
- 5161 Lindell Rd Unit 207
- 5161 Lindell Rd Unit 202
- 5161 Lindell Rd Unit 101