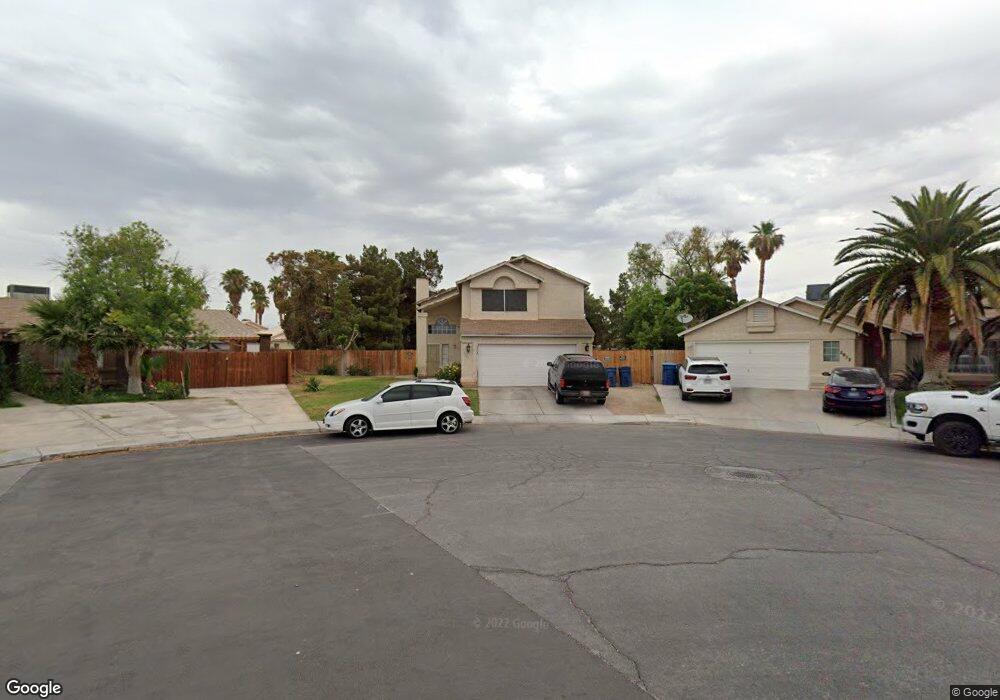
5602 Gazebo Way Las Vegas, NV 89142
Estimated Value: $362,641 - $411,000
3
Beds
2
Baths
1,509
Sq Ft
$256/Sq Ft
Est. Value
About This Home
This home is located at 5602 Gazebo Way, Las Vegas, NV 89142 and is currently estimated at $386,660, approximately $256 per square foot. 5602 Gazebo Way is a home located in Clark County with nearby schools including John F. Mendoza Elementary School, Duane D. Keller Middle School, and Las Vegas High School.
Ownership History
Date
Name
Owned For
Owner Type
Purchase Details
Closed on
Sep 16, 2010
Sold by
Torres Simon M and Torres Tina M
Bought by
Torres Tina M
Current Estimated Value
Purchase Details
Closed on
Apr 15, 2002
Sold by
Richards Judith A and Sucato Vincent
Bought by
Torres Simon M and Torres Tina M
Home Financials for this Owner
Home Financials are based on the most recent Mortgage that was taken out on this home.
Original Mortgage
$142,980
Outstanding Balance
$60,624
Interest Rate
7.13%
Mortgage Type
FHA
Estimated Equity
$326,036
Purchase Details
Closed on
Jan 15, 1998
Sold by
Bolden Curtiss
Bought by
Richards John H and Richards Judith A
Purchase Details
Closed on
Jun 3, 1996
Sold by
Bolden Elizabeth
Bought by
Bolden Curtiss
Purchase Details
Closed on
Sep 1, 1993
Sold by
Margraves Steven S and Margraves Aimee R
Bought by
Nevada Housing Division
Create a Home Valuation Report for This Property
The Home Valuation Report is an in-depth analysis detailing your home's value as well as a comparison with similar homes in the area
Home Values in the Area
Average Home Value in this Area
Purchase History
| Date | Buyer | Sale Price | Title Company |
|---|---|---|---|
| Torres Tina M | -- | None Available | |
| Torres Simon M | $145,000 | Pioneer National Title | |
| Richards John H | -- | -- | |
| Bolden Curtiss | -- | -- | |
| Nevada Housing Division | -- | -- |
Source: Public Records
Mortgage History
| Date | Status | Borrower | Loan Amount |
|---|---|---|---|
| Open | Torres Simon M | $142,980 |
Source: Public Records
Tax History Compared to Growth
Tax History
| Year | Tax Paid | Tax Assessment Tax Assessment Total Assessment is a certain percentage of the fair market value that is determined by local assessors to be the total taxable value of land and additions on the property. | Land | Improvement |
|---|---|---|---|---|
| 2025 | $870 | $61,500 | $23,100 | $38,400 |
| 2024 | $1,132 | $61,500 | $23,100 | $38,400 |
| 2023 | $1,132 | $63,083 | $26,250 | $36,833 |
| 2022 | $821 | $55,265 | $21,350 | $33,915 |
| 2021 | $797 | $52,451 | $19,950 | $32,501 |
| 2020 | $771 | $51,370 | $18,900 | $32,470 |
| 2019 | $748 | $46,474 | $14,350 | $32,124 |
| 2018 | $727 | $44,152 | $13,300 | $30,852 |
| 2017 | $1,228 | $41,855 | $10,500 | $31,355 |
| 2016 | $941 | $39,526 | $7,700 | $31,826 |
| 2015 | $687 | $29,604 | $5,600 | $24,004 |
| 2014 | $667 | $23,982 | $5,250 | $18,732 |
Source: Public Records
Map
Nearby Homes
- 1841 Skywood Way
- 2229 Bowstring Dr
- 1950 Abarth St
- 2306 Abarth St
- 1745 Starridge Way
- 1919 Niblick Cir
- 1728 S Christy Ln
- 1721 Starridge Way
- 5849 Emerald Canyon Dr
- 5650 E Sahara Ave Unit 2010
- 5650 E Sahara Ave Unit 2007
- 5650 E Sahara Ave Unit 1035
- 5325 Sandstone Dr
- 2484 Anglia St
- 5444 Alpaca Cir
- 2307 Tuscarora Ct
- 1487 Elaine Dr
- 2508 Alfa Cir
- 5655 E Sahara Ave Unit 2048
- 5655 E Sahara Ave Unit 2009
- 5612 Gazebo Way
- 2043 Seahurst Dr
- 2020 Brassy Dr
- 2012 Brassy Dr
- 2034 Brassy Dr
- 5591 Ballinger Dr
- 1998 Brassy Dr
- 2042 Brassy Dr
- 5595 Ballinger Dr
- 5622 Gazebo Way
- 2063 Seahurst Dr
- 1990 Brassy Dr
- 2054 Brassy Dr
- 5615 Ballinger Dr
- 1982 Brassy Dr
- 2058 Brassy Dr
- 5632 Gazebo Way
- 2069 Seahurst Dr
- 2062 Seahurst Dr
- 5625 Ballinger Dr