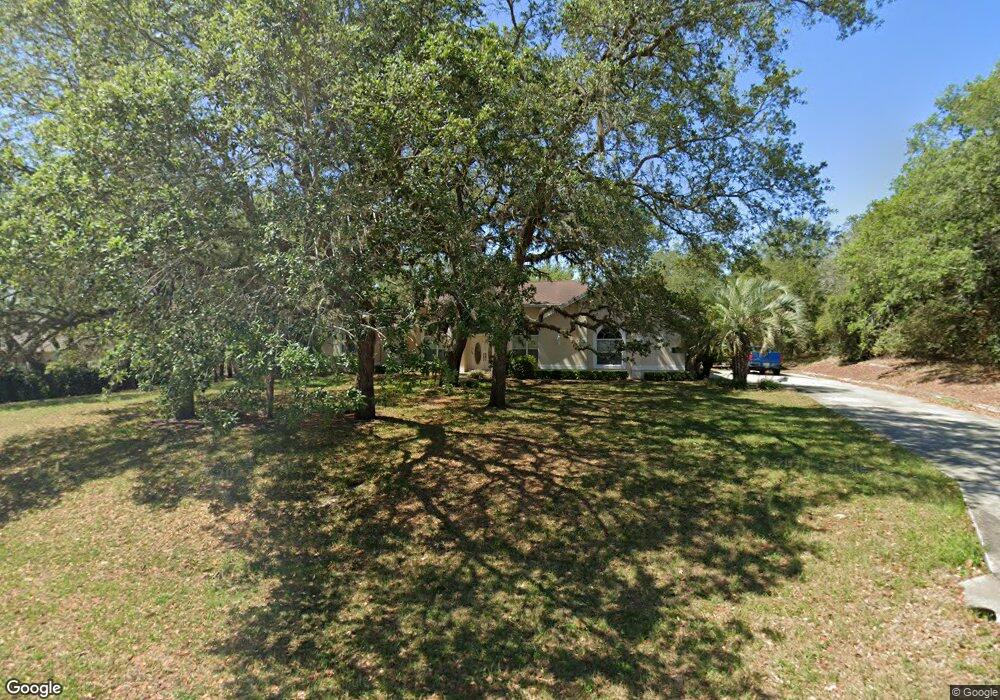
5603 N Rosedale Cir Beverly Hills, FL 34465
Estimated Value: $486,064 - $681,000
4
Beds
3
Baths
2,703
Sq Ft
$208/Sq Ft
Est. Value
About This Home
This home is located at 5603 N Rosedale Cir, Beverly Hills, FL 34465 and is currently estimated at $561,766, approximately $207 per square foot. 5603 N Rosedale Cir is a home located in Citrus County with nearby schools including Central Ridge Elementary School, Crystal River High School, and Crystal River Middle School.
Ownership History
Date
Name
Owned For
Owner Type
Purchase Details
Closed on
Jun 22, 2011
Sold by
Thompson Jerry M and Thompson Wanda F
Bought by
Sergent Nelson R and Sergent Cynthia H
Current Estimated Value
Home Financials for this Owner
Home Financials are based on the most recent Mortgage that was taken out on this home.
Original Mortgage
$246,850
Outstanding Balance
$170,333
Interest Rate
4.65%
Mortgage Type
VA
Estimated Equity
$391,433
Purchase Details
Closed on
Jun 1, 2001
Sold by
Gallipoli Peter J and Gallipoli Kathleen A
Bought by
Thompson Jerry M and Thompson Wanda F
Home Financials for this Owner
Home Financials are based on the most recent Mortgage that was taken out on this home.
Original Mortgage
$211,755
Interest Rate
7.05%
Purchase Details
Closed on
Nov 1, 1994
Bought by
Sergent Nelson R and Sergent Cynthia H
Purchase Details
Closed on
May 1, 1991
Bought by
Sergent Nelson R and Sergent Cynthia H
Create a Home Valuation Report for This Property
The Home Valuation Report is an in-depth analysis detailing your home's value as well as a comparison with similar homes in the area
Home Values in the Area
Average Home Value in this Area
Purchase History
| Date | Buyer | Sale Price | Title Company |
|---|---|---|---|
| Sergent Nelson R | $239,000 | American Title Services Of C | |
| Thompson Jerry M | $222,900 | Future Title Services Inc | |
| Sergent Nelson R | $25,000 | -- | |
| Sergent Nelson R | $28,000 | -- |
Source: Public Records
Mortgage History
| Date | Status | Borrower | Loan Amount |
|---|---|---|---|
| Open | Sergent Nelson R | $246,850 | |
| Previous Owner | Thompson Jerry M | $211,755 |
Source: Public Records
Tax History Compared to Growth
Tax History
| Year | Tax Paid | Tax Assessment Tax Assessment Total Assessment is a certain percentage of the fair market value that is determined by local assessors to be the total taxable value of land and additions on the property. | Land | Improvement |
|---|---|---|---|---|
| 2024 | $2,961 | $231,651 | -- | -- |
| 2023 | $2,961 | $224,904 | $0 | $0 |
| 2022 | $2,773 | $218,353 | $0 | $0 |
| 2021 | $2,662 | $211,993 | $0 | $0 |
| 2020 | $2,564 | $260,665 | $26,270 | $234,395 |
| 2019 | $2,533 | $251,347 | $29,710 | $221,637 |
| 2018 | $2,508 | $224,660 | $28,480 | $196,180 |
| 2017 | $2,502 | $196,430 | $33,910 | $162,520 |
| 2016 | $2,535 | $192,390 | $24,920 | $167,470 |
| 2015 | $2,631 | $194,485 | $24,920 | $169,565 |
| 2014 | $2,841 | $201,792 | $49,176 | $152,616 |
Source: Public Records
Map
Nearby Homes
- 3563 W Blossom Dr
- The Riley Plan at Pine Ridge Estates
- The Avery Plan at Pine Ridge Estates
- 5245 N Allamandra Dr
- 5455 N Rosedale Cir
- 5050 N Coconut Terrace
- 5039 N Elkcam Blvd
- 3064 W Pine Ridge Blvd
- 5352 N Mock Orange Dr
- 4963 N Elkcam Blvd
- 3016 W Pine Ridge Blvd
- 2888 W Verbena Place
- 4827 N Capistrano Loop
- 4805 N Capistrano Loop
- 3275 W Daffodil Dr
- 3396 W Promontory Dr
- 5950 N Petunia Terrace
- 5881 N Sultana Terrace
- 2978 W Beamwood Dr
- 6084 N Orchis Terrace
- 5609 N Rosedale St
- 5595 N Rosedale Cir
- 5609 N Rosedale Cir
- 5600 N Rosedale Cir
- 5590 N Rosedale Cir
- 3415 W Blossom Dr
- 5575 N Rosedale Cir
- 5580 N Rosedale Cir
- 3473 W Blossom Dr
- 5620 N Rosedale Cir
- 3375 W Blossom Dr
- 5410 N Rosedale Cir
- 3501 W Blossom Dr
- 5625 N Rosedale Cir
- 5407 N Rosedale Cir
- 3529 W Blossom Dr
- 5420 N Rosedale Cir
- 3303 W Blossom Dr
- 5570 N Rosedale Cir
- 5463 N Allamandra Dr