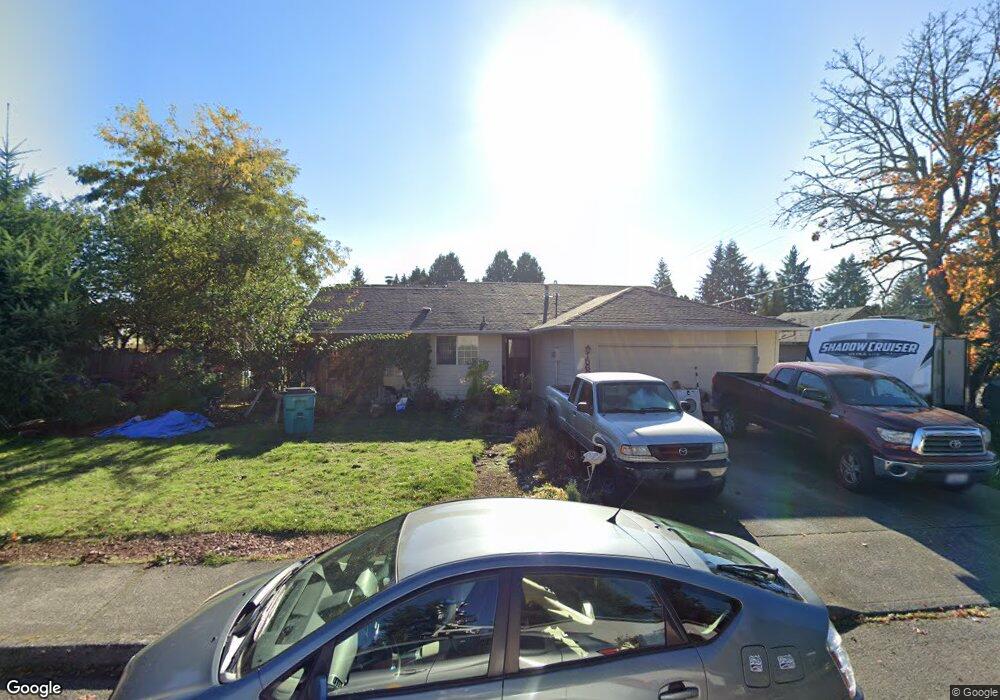
5603 NE 56th St Vancouver, WA 98661
Minnehaha NeighborhoodEstimated Value: $430,934 - $464,000
3
Beds
2
Baths
1,160
Sq Ft
$385/Sq Ft
Est. Value
About This Home
This home is located at 5603 NE 56th St, Vancouver, WA 98661 and is currently estimated at $446,234, approximately $384 per square foot. 5603 NE 56th St is a home located in Clark County with nearby schools including Minnehaha Elementary School, Jason Lee Middle School, and Hudson's Bay High School.
Ownership History
Date
Name
Owned For
Owner Type
Purchase Details
Closed on
Jun 24, 2008
Sold by
Morgunova Yelena
Bought by
Morgunov Ruslan N
Current Estimated Value
Home Financials for this Owner
Home Financials are based on the most recent Mortgage that was taken out on this home.
Original Mortgage
$193,420
Outstanding Balance
$123,736
Interest Rate
5.99%
Mortgage Type
Purchase Money Mortgage
Estimated Equity
$322,498
Purchase Details
Closed on
Jun 10, 2004
Sold by
Va
Bought by
Verbovskiy Vitaliy N and Verbovskiy Yelena
Home Financials for this Owner
Home Financials are based on the most recent Mortgage that was taken out on this home.
Original Mortgage
$142,500
Interest Rate
5.95%
Mortgage Type
Purchase Money Mortgage
Purchase Details
Closed on
Oct 27, 1997
Sold by
Storlie Frances J
Bought by
Dimartino John James and Dimartino Marsha S
Home Financials for this Owner
Home Financials are based on the most recent Mortgage that was taken out on this home.
Original Mortgage
$124,440
Interest Rate
7.36%
Mortgage Type
VA
Create a Home Valuation Report for This Property
The Home Valuation Report is an in-depth analysis detailing your home's value as well as a comparison with similar homes in the area
Home Values in the Area
Average Home Value in this Area
Purchase History
| Date | Buyer | Sale Price | Title Company |
|---|---|---|---|
| Morgunov Ruslan N | -- | Fidelity National Title | |
| Morgunov Ruslan N | $203,600 | Fidelity National Title | |
| Verbovskiy Vitaliy N | -- | Fidelity National Title | |
| Dimartino John James | $122,000 | Clark County Title |
Source: Public Records
Mortgage History
| Date | Status | Borrower | Loan Amount |
|---|---|---|---|
| Open | Morgunov Ruslan N | $193,420 | |
| Previous Owner | Verbovskiy Vitaliy N | $142,500 | |
| Previous Owner | Dimartino John James | $124,440 |
Source: Public Records
Tax History Compared to Growth
Tax History
| Year | Tax Paid | Tax Assessment Tax Assessment Total Assessment is a certain percentage of the fair market value that is determined by local assessors to be the total taxable value of land and additions on the property. | Land | Improvement |
|---|---|---|---|---|
| 2025 | $3,706 | $380,720 | $174,000 | $206,720 |
| 2024 | $3,604 | $368,208 | $174,000 | $194,208 |
| 2023 | $3,461 | $374,321 | $165,000 | $209,321 |
| 2022 | $3,251 | $363,917 | $174,000 | $189,917 |
| 2021 | $3,062 | $312,598 | $150,000 | $162,598 |
| 2020 | $2,781 | $276,193 | $122,500 | $153,693 |
| 2019 | $2,527 | $257,828 | $107,100 | $150,728 |
| 2018 | $2,680 | $243,359 | $0 | $0 |
| 2017 | $2,375 | $214,074 | $0 | $0 |
| 2016 | $2,289 | $198,610 | $0 | $0 |
| 2015 | $2,258 | $177,655 | $0 | $0 |
| 2014 | -- | $165,041 | $0 | $0 |
| 2013 | -- | $146,566 | $0 | $0 |
Source: Public Records
Map
Nearby Homes
- 0 NE 56th Ave
- 5503 NE 53rd Cir
- 5320 NE 54th St
- 6007 NE 55th Cir
- 5517 NE 61st Ct
- 5415 NE 52nd St
- 5616 NE 59th Way
- 5310 NE 53rd Ct
- 5710 NE 62nd St
- 6314 NE 58th St
- 6000 NE 51st Ave
- 5927 NE 49th St
- 5902 NE 48th St
- 5403 NE 65th Place
- Magnolia Plan at Cottages at 66th
- Laurel Plan at Cottages at 66th
- 5415 NE 65th Place
- 5505 NE 65th Place
- 5407 NE 65th Place
- 5419 NE 65th Place
- 5606 NE 55th Cir
- 5602 NE 55th Cir
- 5610 NE 55th Cir
- 5619 NE 56th St
- 5601 NE 56th Ave
- 5616 NE 55th Cir
- 5511 NE 56th St
- 5618 NE 56th St
- 5700 NE 55th Cir
- 5508 NE 55th St
- 5508 NE 56th Ave
- 5705 NE 56th St
- 0 NE 56th St Unit NWM292215
- 0 NE 56th St Unit 23 8034088
- 0 NE 56th St
- 5704 NE 55th Cir
- 5506 NE 55th St
- 5609 NE 56th Ave
- 5605 NE 55th Cir
- 5510 NE 56th St