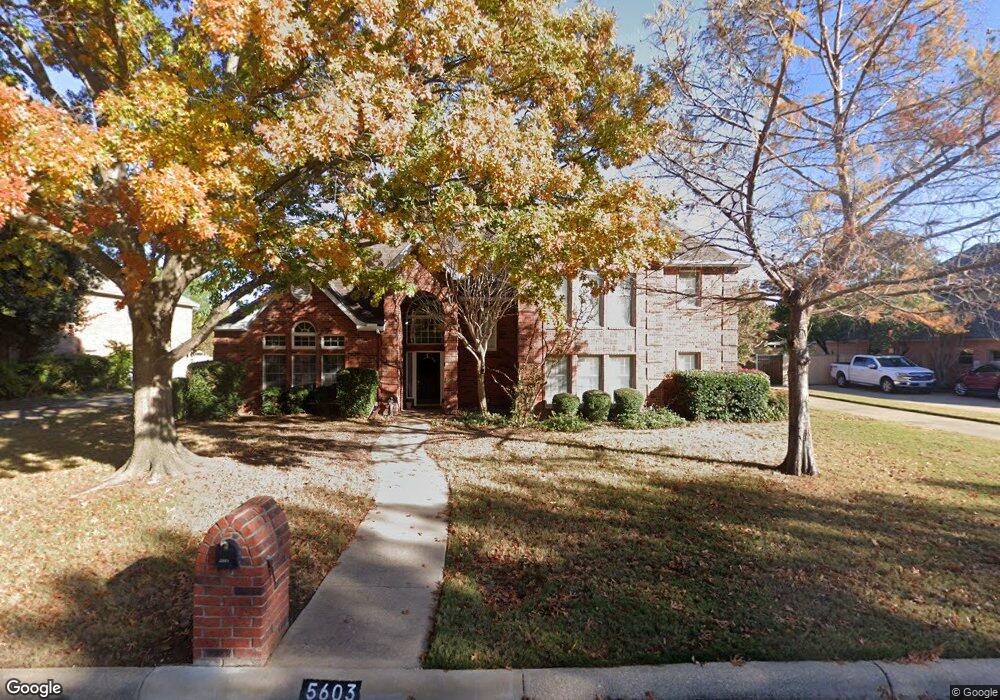
5603 Poplar Ct W Colleyville, TX 76034
Estimated Value: $983,000 - $1,014,000
4
Beds
3
Baths
3,769
Sq Ft
$265/Sq Ft
Est. Value
About This Home
This home is located at 5603 Poplar Ct W, Colleyville, TX 76034 and is currently estimated at $998,780, approximately $264 per square foot. 5603 Poplar Ct W is a home located in Tarrant County with nearby schools including O.C. Taylor Elementary School, Colleyville Middle School, and Waypoint Montessori.
Ownership History
Date
Name
Owned For
Owner Type
Purchase Details
Closed on
Jul 11, 2005
Sold by
Johnson Kelly and Johnson Robbin
Bought by
Wylie C Todd and Wylie Erica C
Current Estimated Value
Home Financials for this Owner
Home Financials are based on the most recent Mortgage that was taken out on this home.
Original Mortgage
$320,000
Outstanding Balance
$166,828
Interest Rate
5.64%
Mortgage Type
Fannie Mae Freddie Mac
Estimated Equity
$831,952
Purchase Details
Closed on
Jun 15, 1999
Sold by
Quarnstrom Thomas F and Evers Carrie C
Bought by
Johnson Kelly
Home Financials for this Owner
Home Financials are based on the most recent Mortgage that was taken out on this home.
Original Mortgage
$249,600
Interest Rate
7.02%
Purchase Details
Closed on
May 29, 1998
Sold by
Zugaro Lawrence and Zugaro Michele F
Bought by
Quarnstrom Thomas F and Evers Carrie C
Home Financials for this Owner
Home Financials are based on the most recent Mortgage that was taken out on this home.
Original Mortgage
$195,000
Interest Rate
7.2%
Create a Home Valuation Report for This Property
The Home Valuation Report is an in-depth analysis detailing your home's value as well as a comparison with similar homes in the area
Home Values in the Area
Average Home Value in this Area
Purchase History
| Date | Buyer | Sale Price | Title Company |
|---|---|---|---|
| Wylie C Todd | -- | -- | |
| Johnson Kelly | -- | Alamo Title Company | |
| Quarnstrom Thomas F | -- | Stewart Title North Texas In |
Source: Public Records
Mortgage History
| Date | Status | Borrower | Loan Amount |
|---|---|---|---|
| Open | Wylie C Todd | $320,000 | |
| Previous Owner | Johnson Kelly | $249,600 | |
| Previous Owner | Quarnstrom Thomas F | $195,000 |
Source: Public Records
Tax History Compared to Growth
Tax History
| Year | Tax Paid | Tax Assessment Tax Assessment Total Assessment is a certain percentage of the fair market value that is determined by local assessors to be the total taxable value of land and additions on the property. | Land | Improvement |
|---|---|---|---|---|
| 2025 | $3,193 | $800,000 | $230,050 | $569,950 |
| 2024 | $3,193 | $851,490 | $230,050 | $621,440 |
| 2023 | $12,024 | $930,865 | $230,050 | $700,815 |
| 2022 | $12,799 | $767,364 | $230,050 | $537,314 |
| 2021 | $12,937 | $589,112 | $138,030 | $451,082 |
| 2020 | $14,206 | $642,030 | $138,030 | $504,000 |
| 2019 | $13,437 | $581,168 | $138,030 | $443,138 |
| 2018 | $3,175 | $534,016 | $95,000 | $439,016 |
| 2017 | $12,145 | $514,074 | $95,000 | $419,074 |
| 2016 | $11,172 | $506,788 | $95,000 | $411,788 |
| 2015 | $9,764 | $429,900 | $50,000 | $379,900 |
| 2014 | $9,764 | $429,900 | $50,000 | $379,900 |
Source: Public Records
Map
Nearby Homes
- 5504 Sycamore Dr
- 5404 Miramar Ln
- 5613 Versailles Ct
- 2906 Cottonwood Ln
- 4214 Hearthside Dr
- 3216 Glade Rd
- 5508 Coventry Ct
- 4213 Hearthside Dr
- 2906 Edgewood Ln
- 1813 Grosvenor Green
- 4282 Hearthside Dr
- 3329 Moss Creek Dr
- Lot 4 Amelia Ct
- 3321 Circlewood Ct
- 4723 Bill Simmons Rd
- 4816 Bill Simmons Rd
- 5317 Bluebonnet Dr
- 1512 Four Seasons Dr
- 2008 Kyle Ct
- 3278 Birch Ave
- 5601 Poplar Ct W
- 5605 Poplar Ct W
- 2400 Poplar Ct E
- 5607 Poplar Ct W
- 2401 Spruce Ct
- 5602 Poplar Ct W
- 5600 Poplar Ct W
- 5604 Poplar Ct W
- 2307 Poplar Ln
- 2305 Poplar Ln
- 5606 Poplar Ct W
- 2402 Poplar Ct E
- 2403 Spruce Ct
- 2303 Poplar Ln
- 2401 Poplar Ct E
- 5606 Amador Trail
- 2400 Spruce Ct
- 2301 Poplar Ln
- 2403 Poplar Ct E
- 2404 Poplar Ct E