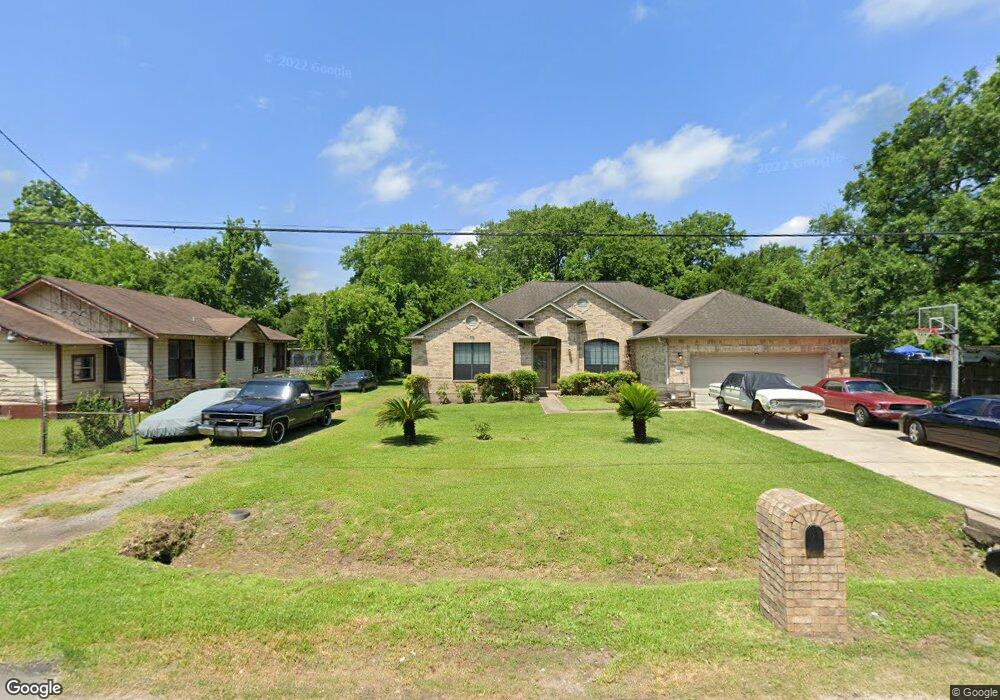
5603 Wayne St Houston, TX 77026
Trinity-Houston Gardens NeighborhoodEstimated Value: $232,000 - $343,000
3
Beds
3
Baths
2,309
Sq Ft
$133/Sq Ft
Est. Value
About This Home
This home is located at 5603 Wayne St, Houston, TX 77026 and is currently estimated at $308,011, approximately $133 per square foot. 5603 Wayne St is a home located in Harris County with nearby schools including Kashmere Gardens Elementary School, Key Middle, and Kashmere High School.
Ownership History
Date
Name
Owned For
Owner Type
Purchase Details
Closed on
Dec 28, 2007
Sold by
Senee Homes Inc
Bought by
Ferguson Darryl L and Ferguson Johnetta Powell
Current Estimated Value
Home Financials for this Owner
Home Financials are based on the most recent Mortgage that was taken out on this home.
Original Mortgage
$174,000
Outstanding Balance
$110,232
Interest Rate
6.23%
Mortgage Type
Purchase Money Mortgage
Estimated Equity
$197,779
Purchase Details
Closed on
Jun 13, 2007
Sold by
Ferguson Johnetta Powell and Ferguson Darry
Bought by
Senee Homes Inc
Purchase Details
Closed on
May 2, 2006
Sold by
Powell Rev J Royster
Bought by
Ferguson Johnetta Powell
Purchase Details
Closed on
Feb 3, 2005
Sold by
Powell John R
Bought by
Powell Johnetta
Purchase Details
Closed on
Nov 23, 2004
Sold by
Loria Josephine
Bought by
Powell John R
Create a Home Valuation Report for This Property
The Home Valuation Report is an in-depth analysis detailing your home's value as well as a comparison with similar homes in the area
Home Values in the Area
Average Home Value in this Area
Purchase History
| Date | Buyer | Sale Price | Title Company |
|---|---|---|---|
| Ferguson Darryl L | -- | American Title Co | |
| Senee Homes Inc | -- | American Title Co | |
| Ferguson Johnetta Powell | -- | None Available | |
| Powell Johnetta | -- | -- | |
| Powell John R | -- | -- |
Source: Public Records
Mortgage History
| Date | Status | Borrower | Loan Amount |
|---|---|---|---|
| Open | Ferguson Darryl L | $174,000 |
Source: Public Records
Tax History Compared to Growth
Tax History
| Year | Tax Paid | Tax Assessment Tax Assessment Total Assessment is a certain percentage of the fair market value that is determined by local assessors to be the total taxable value of land and additions on the property. | Land | Improvement |
|---|---|---|---|---|
| 2025 | $2,997 | $402,569 | $128,640 | $273,929 |
| 2024 | $2,997 | $342,336 | $105,600 | $236,736 |
| 2023 | $2,997 | $331,276 | $86,400 | $244,876 |
| 2022 | $4,195 | $281,292 | $57,600 | $223,692 |
| 2021 | $4,037 | $229,758 | $57,600 | $172,158 |
| 2020 | $3,813 | $201,323 | $38,400 | $162,923 |
| 2019 | $3,622 | $147,962 | $31,680 | $116,282 |
| 2018 | $2,346 | $130,140 | $31,680 | $98,460 |
| 2017 | $3,291 | $130,140 | $31,680 | $98,460 |
| 2016 | $3,246 | $128,366 | $28,800 | $99,566 |
| 2015 | $2,616 | $117,136 | $23,400 | $93,736 |
| 2014 | $2,616 | $135,207 | $23,400 | $111,807 |
Source: Public Records
Map
Nearby Homes
- 5618 Kashmere St
- 4413 Kelley St
- 5305 Kashmere St
- 5806 Hirsch Rd
- 4421 Caplin St
- 4026 Reid St
- 4034 Caplin St
- 4921 Kashmere St
- 6226 Kashmere St
- 6305 Kashmere St
- 5609 Pickfair St
- 5020 Sayers St
- 3933 Linder St
- 5015 Falls St Unit 5
- 4918 Leffingwell St
- 4921 Wipprecht St
- 5025 Falls St
- 5217 Pickfair St
- 4819 Los Angeles St
- 4817 Los Angeles St
- 5517 Wayne St
- 5513 Wayne St
- 5611 Wayne St
- 5509 Wayne St
- 5618 Los Angeles St
- 5616 Los Angeles St
- 5624 Los Angeles St
- 5622 Los Angeles St
- 5613 Wayne St
- 5602 Wayne St
- 5604 Wayne St
- 5610 Wayne St
- 5612 Wayne St
- 5501 Wayne St
- 5510 Wayne St
- 5702 Los Angeles St
- 5614 Wayne St
- 4303 Fairbanks St
- 5502 Wayne St
- 5616 Wayne St