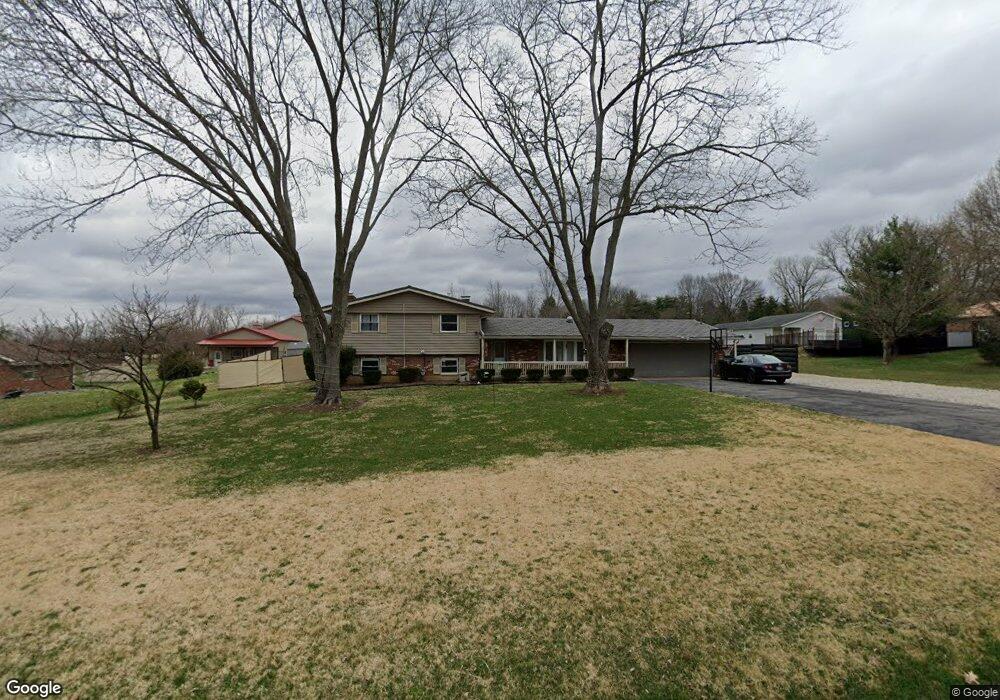
5604 Broadway Rd Springfield, OH 45502
Estimated Value: $330,000 - $357,000
4
Beds
2
Baths
1,957
Sq Ft
$174/Sq Ft
Est. Value
About This Home
This home is located at 5604 Broadway Rd, Springfield, OH 45502 and is currently estimated at $340,123, approximately $173 per square foot. 5604 Broadway Rd is a home located in Clark County with nearby schools including Greenon Elementary School, Greenon Jr. High School, and Greenon High School.
Ownership History
Date
Name
Owned For
Owner Type
Purchase Details
Closed on
May 10, 2019
Sold by
Hance Edward and Hance Patricia S
Bought by
Logan Michael Jonathan
Current Estimated Value
Home Financials for this Owner
Home Financials are based on the most recent Mortgage that was taken out on this home.
Original Mortgage
$209,407
Outstanding Balance
$182,190
Interest Rate
4%
Mortgage Type
VA
Estimated Equity
$157,933
Purchase Details
Closed on
Jan 11, 2019
Sold by
Hance Edward J and Hance Patricia S
Bought by
Hance Edward
Purchase Details
Closed on
Dec 6, 2018
Sold by
Hance Pamela K and Schaefer Pamela K
Bought by
Hance Edward J and Hance Edward
Purchase Details
Closed on
May 7, 2018
Sold by
Hance Pamela K and Schaefer Pamela K
Bought by
Hance Edward J and Hance Edward
Purchase Details
Closed on
Feb 4, 2003
Sold by
Hance Edward
Bought by
Hance Pamela
Purchase Details
Closed on
Jul 11, 1986
Create a Home Valuation Report for This Property
The Home Valuation Report is an in-depth analysis detailing your home's value as well as a comparison with similar homes in the area
Purchase History
| Date | Buyer | Sale Price | Title Company |
|---|---|---|---|
| Logan Michael Jonathan | $205,000 | Wave Title Agency | |
| Hance Edward | -- | None Available | |
| Smith Glyn R | $12,000 | None Available | |
| Hance Edward J | -- | None Available | |
| Hance Edward J | -- | None Available | |
| Hance Pamela | -- | -- | |
| -- | $92,000 | -- |
Source: Public Records
Mortgage History
| Date | Status | Borrower | Loan Amount |
|---|---|---|---|
| Open | Logan Michael Jonathan | $209,407 |
Source: Public Records
Tax History
| Year | Tax Paid | Tax Assessment Tax Assessment Total Assessment is a certain percentage of the fair market value that is determined by local assessors to be the total taxable value of land and additions on the property. | Land | Improvement |
|---|---|---|---|---|
| 2025 | $4,825 | $106,970 | $16,310 | $90,660 |
| 2024 | $4,711 | $89,910 | $14,780 | $75,130 |
| 2023 | $4,711 | $89,910 | $14,780 | $75,130 |
| 2022 | $4,706 | $89,910 | $14,780 | $75,130 |
| 2021 | $3,976 | $67,310 | $10,710 | $56,600 |
| 2020 | $3,613 | $61,130 | $10,710 | $50,420 |
| 2019 | $3,925 | $65,410 | $14,990 | $50,420 |
| 2018 | $3,291 | $53,620 | $13,740 | $39,880 |
| 2017 | $3,299 | $53,617 | $13,741 | $39,876 |
| 2016 | $2,876 | $53,617 | $13,741 | $39,876 |
| 2015 | $1,342 | $48,255 | $12,492 | $35,763 |
| 2014 | $2,690 | $48,255 | $12,492 | $35,763 |
| 2013 | $1,184 | $48,255 | $12,492 | $35,763 |
Source: Public Records
Map
Nearby Homes
- 100 Green Valley Dr
- 303 E Main St
- 141 N Xenia Dr
- 3924 Schenley St
- 4200 Phillips St
- 2925 S Tecumseh Rd
- 4024 Raymond Dr
- 4538 Cynthia Dr
- 144 Matthews Ave
- 1010 Meadow Lark Dr
- 3864 Quailhollow Ct
- 2133 Willow Run Cir Unit 2133
- 2151 Willow Run Cir Unit 2151
- 2072 Willow Run Cir
- 5463 Enon-Xenia Rd
- 7050 Creekside Cir
- 5152 S Tecumseh Rd
- 199 Fairfield Pike
- 6250 Fairfield Pike
- 4600 Snider Rd
- 5730 Broadway Rd
- 5590 Broadway Rd
- 5662 Broadway Rd
- 3385 Fowler Rd
- 5740 Broadway Rd
- 5740 Broadway Rd
- 5642 Broadway Rd
- 3341 Fowler Rd
- 5746 Broadway Rd
- 3312 Fowler Rd
- 5760 Broadway Rd
- 3652 Fowler Rd
- 5432 Broadway Rd
- 3233 Fowler Rd
- 3590 Fowler Rd
- 420 Broadway Ave
- 5361 Broadway Rd
- 88 Skyline Dr
- 3716 Fowler Rd
- 86 Skyline Dr
Your Personal Tour Guide
Ask me questions while you tour the home.