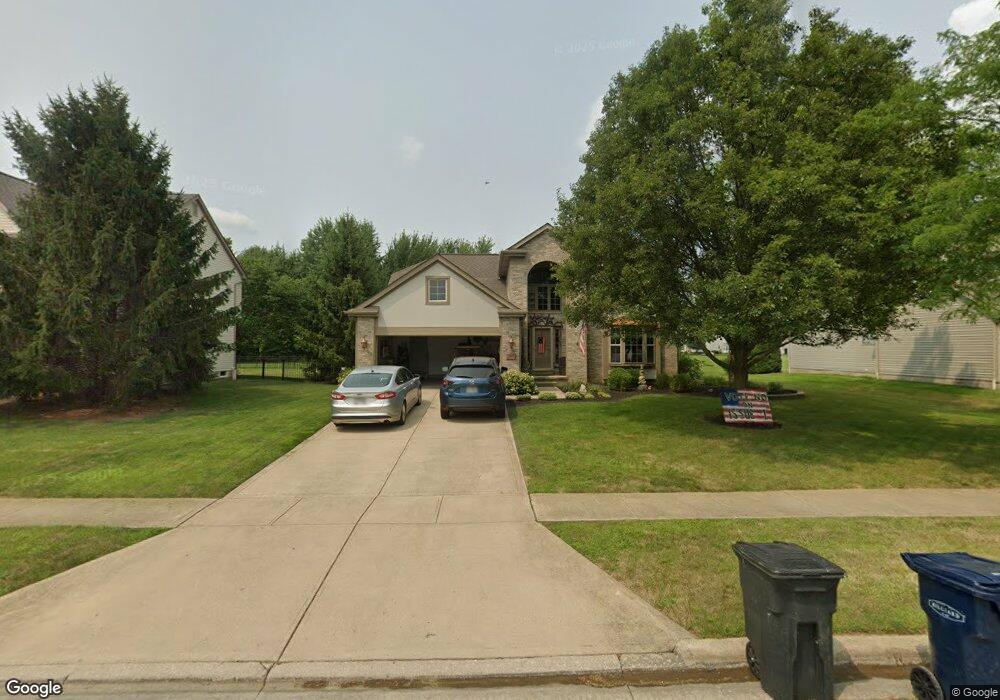
5604 Weston Trail Dr Hilliard, OH 43026
Estimated Value: $546,861 - $593,000
4
Beds
3
Baths
3,257
Sq Ft
$177/Sq Ft
Est. Value
About This Home
This home is located at 5604 Weston Trail Dr, Hilliard, OH 43026 and is currently estimated at $575,715, approximately $176 per square foot. 5604 Weston Trail Dr is a home located in Franklin County with nearby schools including Avery Elementary School, Hilliard Tharp Sixth Grade Elementary School, and Hilliard Weaver Middle School.
Ownership History
Date
Name
Owned For
Owner Type
Purchase Details
Closed on
Apr 15, 2010
Sold by
Gigliotti Daniel A and Gigliotti Jennifer R
Bought by
Dawes Danny J and Dawes Jeanette M
Current Estimated Value
Home Financials for this Owner
Home Financials are based on the most recent Mortgage that was taken out on this home.
Original Mortgage
$173,000
Outstanding Balance
$115,338
Interest Rate
5.02%
Mortgage Type
New Conventional
Estimated Equity
$460,377
Purchase Details
Closed on
Nov 7, 2000
Sold by
Trinity Home Builders Inc
Bought by
Gigliotti Daniel A and Gigliotti Jennifer R
Home Financials for this Owner
Home Financials are based on the most recent Mortgage that was taken out on this home.
Original Mortgage
$213,000
Interest Rate
7.87%
Mortgage Type
Stand Alone Second
Create a Home Valuation Report for This Property
The Home Valuation Report is an in-depth analysis detailing your home's value as well as a comparison with similar homes in the area
Home Values in the Area
Average Home Value in this Area
Purchase History
| Date | Buyer | Sale Price | Title Company |
|---|---|---|---|
| Dawes Danny J | $259,900 | Attorney | |
| Gigliotti Daniel A | $224,300 | Preferred Title Agency Inc |
Source: Public Records
Mortgage History
| Date | Status | Borrower | Loan Amount |
|---|---|---|---|
| Open | Dawes Danny J | $173,000 | |
| Closed | Gigliotti Daniel A | $213,000 |
Source: Public Records
Tax History Compared to Growth
Tax History
| Year | Tax Paid | Tax Assessment Tax Assessment Total Assessment is a certain percentage of the fair market value that is determined by local assessors to be the total taxable value of land and additions on the property. | Land | Improvement |
|---|---|---|---|---|
| 2024 | $11,427 | $170,600 | $41,200 | $129,400 |
| 2023 | $9,305 | $170,590 | $41,195 | $129,395 |
| 2022 | $8,444 | $123,210 | $25,100 | $98,110 |
| 2021 | $8,438 | $123,210 | $25,100 | $98,110 |
| 2020 | $8,417 | $123,210 | $25,100 | $98,110 |
| 2019 | $8,184 | $101,960 | $20,930 | $81,030 |
| 2018 | $7,769 | $101,960 | $20,930 | $81,030 |
| 2017 | $7,985 | $101,960 | $20,930 | $81,030 |
| 2016 | $7,816 | $90,480 | $18,410 | $72,070 |
| 2015 | $7,382 | $90,480 | $18,410 | $72,070 |
| 2014 | $7,395 | $90,480 | $18,410 | $72,070 |
| 2013 | $3,574 | $86,170 | $17,535 | $68,635 |
Source: Public Records
Map
Nearby Homes
- 5628 Weston Trail Dr
- 5633 Maple Dell Ct
- 4446 Braithway St
- 5620 Aristocrat Dr
- 5404 Crescent Dr
- 5380 Taylor Lane Ave
- 4744 Champion Ln
- 4661 Brownstone Dr
- Provenance Plan at The Courtyards at Carr Farms
- Capri IV Plan at The Courtyards at Carr Farms
- Portico Plan at The Courtyards at Carr Farms
- Verona Plan at The Courtyards at Carr Farms
- Torino II Plan at The Courtyards at Carr Farms
- Salerno II Plan at The Courtyards at Carr Farms
- Palazzo Plan at The Courtyards at Carr Farms
- Promenade III Plan at The Courtyards at Carr Farms
- 5806 Barbara Dr
- 4567 Marilyn St
- 4334 Winterringer St
- 5376 Davidson Rd
- 5616 Weston Trail Dr
- 5594 Weston Trail Dr
- 5584 Weston Trail Dr
- 5599 Weston Trail Dr
- 4501 Mccullough Ln
- 5589 Weston Trail Dr
- 5638 Weston Trail Dr
- 5572 Weston Trail Dr
- 5577 Weston Trail Dr
- 4489 Mccullough Ln
- 4484 Mccullough Ln
- 5639 Weston Trail Dr
- 5648 Weston Trail Dr
- 5562 Weston Trail Dr
- 83 Weston Trail Dr
- 4477 Mccullough Ln
- 4472 Mccullough Ln
- 4579 Brixshire Dr
- 4495 Brixshire Dr
- 5660 Weston Trail Dr