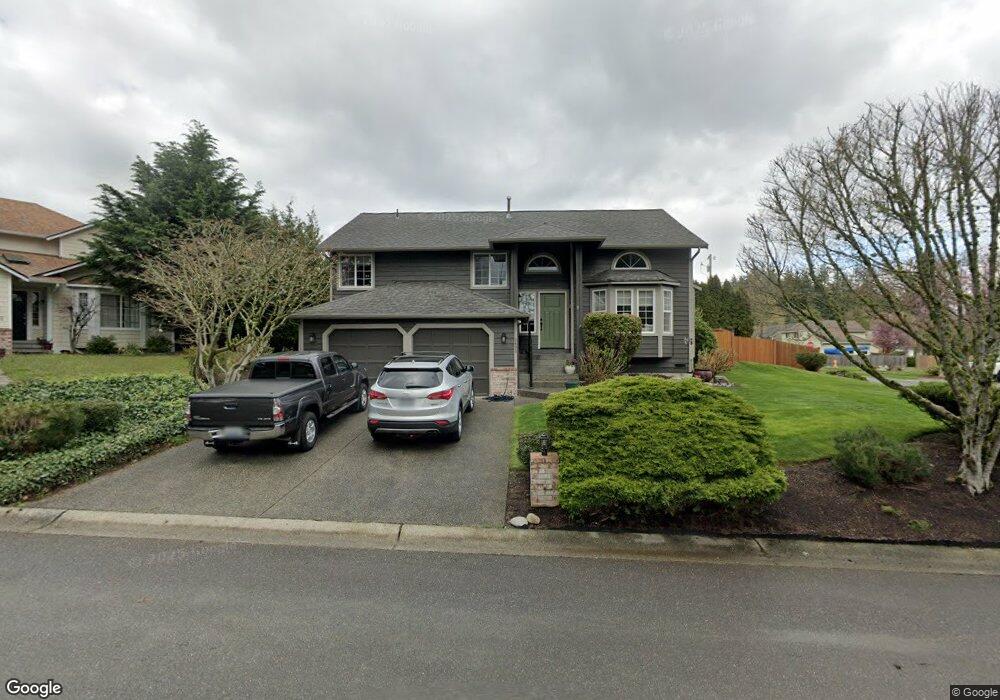
5605 160th Place SW Edmonds, WA 98026
Estimated Value: $791,404 - $937,000
3
Beds
3
Baths
1,830
Sq Ft
$466/Sq Ft
Est. Value
About This Home
This home is located at 5605 160th Place SW, Edmonds, WA 98026 and is currently estimated at $852,101, approximately $465 per square foot. 5605 160th Place SW is a home located in Snohomish County with nearby schools including Beverly Elementary School, Meadowdale Middle School, and Meadowdale High School.
Ownership History
Date
Name
Owned For
Owner Type
Purchase Details
Closed on
Jun 3, 2013
Sold by
Cubbin Debra R
Bought by
Cubbin Debra R and Cubbin Chris D
Current Estimated Value
Home Financials for this Owner
Home Financials are based on the most recent Mortgage that was taken out on this home.
Original Mortgage
$299,400
Outstanding Balance
$211,834
Interest Rate
3.37%
Mortgage Type
New Conventional
Estimated Equity
$640,267
Purchase Details
Closed on
Aug 24, 2008
Sold by
Cubbin Chris D
Bought by
Cubbin Debra R
Purchase Details
Closed on
Jul 2, 2008
Sold by
Cubbin Debra R
Bought by
Cubbin Debra R and Cubbin Chris D
Purchase Details
Closed on
Jul 5, 1995
Sold by
Lessley Construction Inc
Bought by
Cubbin Chris D and Cubbin Debra R
Home Financials for this Owner
Home Financials are based on the most recent Mortgage that was taken out on this home.
Original Mortgage
$145,600
Interest Rate
7.59%
Create a Home Valuation Report for This Property
The Home Valuation Report is an in-depth analysis detailing your home's value as well as a comparison with similar homes in the area
Home Values in the Area
Average Home Value in this Area
Purchase History
| Date | Buyer | Sale Price | Title Company |
|---|---|---|---|
| Cubbin Debra R | -- | Chicago Title Company | |
| Cubbin Debra R | -- | None Available | |
| Cubbin Debra R | $56,179 | Northpoint Escrow & Title Ll | |
| Cubbin Chris D | $182,000 | -- |
Source: Public Records
Mortgage History
| Date | Status | Borrower | Loan Amount |
|---|---|---|---|
| Open | Cubbin Debra R | $299,400 | |
| Previous Owner | Cubbin Chris D | $145,600 |
Source: Public Records
Tax History Compared to Growth
Tax History
| Year | Tax Paid | Tax Assessment Tax Assessment Total Assessment is a certain percentage of the fair market value that is determined by local assessors to be the total taxable value of land and additions on the property. | Land | Improvement |
|---|---|---|---|---|
| 2025 | $6,351 | $746,300 | $462,000 | $284,300 |
| 2024 | $6,351 | $766,200 | $478,000 | $288,200 |
| 2023 | $5,303 | $663,600 | $335,000 | $328,600 |
| 2022 | $6,008 | $616,600 | $335,000 | $281,600 |
| 2020 | $5,800 | $525,700 | $285,000 | $240,700 |
| 2019 | $5,677 | $512,400 | $277,000 | $235,400 |
| 2018 | $5,739 | $456,600 | $246,000 | $210,600 |
| 2017 | $4,911 | $404,100 | $208,000 | $196,100 |
| 2016 | $4,521 | $373,100 | $185,000 | $188,100 |
| 2015 | $4,188 | $327,800 | $155,000 | $172,800 |
| 2013 | $3,995 | $297,300 | $136,000 | $161,300 |
Source: Public Records
Map
Nearby Homes
- 16033 57th Ave W
- 16027 57th Ave W
- 5719 160th St SW
- 5712 160th St SW
- 5714 160th St SW
- 5725 160th St SW
- 5727 160th St SW
- 5728 160th St SW
- 5724 161st St SW
- 5404 158th Place SW
- 5921 160th St SW
- 5411 158th Place SW
- Indigo Plan at Edmonds Ridge
- Lotus Plan at Edmonds Ridge
- Spirea Plan at Edmonds Ridge
- Verbena Plan at Edmonds Ridge
- Azalea Plan at Edmonds Ridge
- Ivy Plan at Edmonds Ridge
- 15914 52nd Ave W
- 5921 164th St SW
- 5608 160th St SW
- 5615 160th Place SW
- 5616 160th St SW
- 5606 160th Place SW
- 5612 160th Place SW
- 5525 160th Place SW
- 5524 160th St SW
- 5624 160th St SW
- 5522 160th Place SW
- 5621 160th St SW
- 5811 160th St SW
- 5810 160th St SW
- 5814 160th St SW
- 5904 160th St SW
- 5707 160th St SW
- 5705 160th St SW
- 5625 160th St SW
- 5518 160th St SW
- 15928 56th Ave W
- 5517 160th Place SW