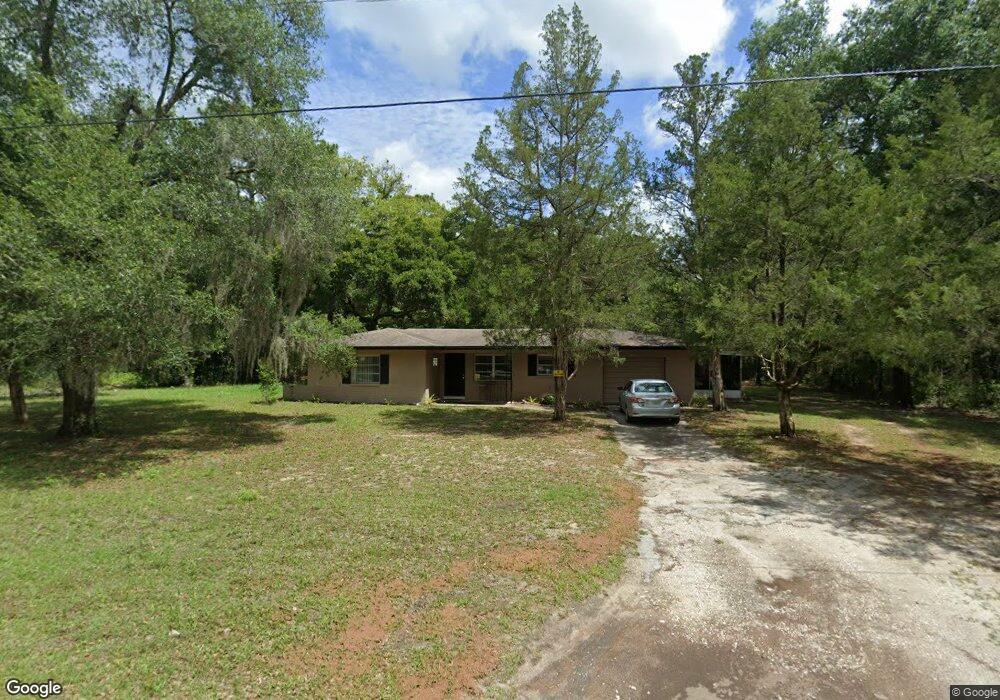
5605 E Tangelo Ln Inverness, FL 34453
Estimated Value: $172,555 - $210,000
2
Beds
2
Baths
953
Sq Ft
$193/Sq Ft
Est. Value
About This Home
This home is located at 5605 E Tangelo Ln, Inverness, FL 34453 and is currently estimated at $184,139, approximately $193 per square foot. 5605 E Tangelo Ln is a home located in Citrus County with nearby schools including Hernando Elementary School, Inverness Middle School, and Citrus High School.
Ownership History
Date
Name
Owned For
Owner Type
Purchase Details
Closed on
Jul 20, 2010
Sold by
Beckwith Lee and Beckwith Jerilynn
Bought by
Beckwith Lee Lewis and Beckwith Jerilynn C
Current Estimated Value
Purchase Details
Closed on
Sep 15, 2008
Sold by
Sovereign Bank
Bought by
Beckwith Lee and Beckwith Jerilynn
Purchase Details
Closed on
Jul 26, 2007
Sold by
Saroop Mary Ann and Case #2006 Ca 004870
Bought by
Sovereign Bank
Purchase Details
Closed on
Jul 1, 2007
Bought by
Beckwith Lee Lewis and Beckwith Jerilynn
Purchase Details
Closed on
Mar 15, 2006
Sold by
Diedrich Josephine E and Carstensen Robert
Bought by
Saroop Mary Ann
Home Financials for this Owner
Home Financials are based on the most recent Mortgage that was taken out on this home.
Original Mortgage
$86,400
Interest Rate
6.19%
Mortgage Type
Fannie Mae Freddie Mac
Create a Home Valuation Report for This Property
The Home Valuation Report is an in-depth analysis detailing your home's value as well as a comparison with similar homes in the area
Home Values in the Area
Average Home Value in this Area
Purchase History
| Date | Buyer | Sale Price | Title Company |
|---|---|---|---|
| Beckwith Lee Lewis | -- | Attorney | |
| Beckwith Lee | $60,000 | Watson Title Ins Agency Inc | |
| Sovereign Bank | -- | None Available | |
| Sovereign Bank | -- | None Available | |
| Beckwith Lee Lewis | $100 | -- | |
| Saroop Mary Ann | $108,000 | American Title Services Of C |
Source: Public Records
Mortgage History
| Date | Status | Borrower | Loan Amount |
|---|---|---|---|
| Previous Owner | Saroop Mary Ann | $86,400 |
Source: Public Records
Tax History Compared to Growth
Tax History
| Year | Tax Paid | Tax Assessment Tax Assessment Total Assessment is a certain percentage of the fair market value that is determined by local assessors to be the total taxable value of land and additions on the property. | Land | Improvement |
|---|---|---|---|---|
| 2024 | $1,638 | $144,414 | $21,060 | $123,354 |
| 2023 | $1,638 | $73,907 | $0 | $0 |
| 2022 | $1,470 | $127,953 | $16,850 | $111,103 |
| 2021 | $1,170 | $84,115 | $4,720 | $79,395 |
| 2020 | $1,054 | $79,680 | $5,930 | $73,750 |
| 2019 | $941 | $65,660 | $5,930 | $59,730 |
| 2018 | $771 | $45,890 | $4,970 | $40,920 |
| 2017 | $747 | $44,692 | $4,230 | $40,462 |
| 2016 | $695 | $38,407 | $3,180 | $35,227 |
| 2015 | $663 | $35,802 | $4,510 | $31,292 |
| 2014 | $707 | $37,150 | $6,154 | $30,996 |
Source: Public Records
Map
Nearby Homes
- 5637 E Tangelo Ln
- 5732 E Tangelo Ln
- 123 N Twin Lakes Dr
- 129 N Azalea Terrace Unit 22
- 5471 E Mimosa Ln
- 5350 E Jasmine Ln
- 63 N Sheltering Oaks Dr
- 96 N Sheltering Oaks Dr
- 47 N Sheltering Oaks Dr
- 5175 E Tangelo Ln
- 1113 Jones Ave
- 1317 Carl St
- 1403 Andrew St
- 1001 Jones Ave
- 916 Jones Ave
- 6301 E Turner Camp Rd
- 407 Hunting Lodge Dr
- 821 Inverie Dr
- 1143 Trailridge Ave
- 820 Inverie Dr
- 34 N Oakwood Terrace
- 149 N Oakwood Terrace
- 5670 E Tangelo Ln
- 5650 E Carlton Ct
- 5576 E Tangelo Ln
- 5656 E Tangelo Ln
- 5605 E Live Oak Ln
- 5535 E Tangelo Ln
- 5676 E Tangelo Ln
- 5684 E Carlton Ct
- 5575 E Live Oak Ln
- 5665 E Live Oak Ln
- 5655 E Carlton Ct
- 5701 E Tangelo Ln
- 123 N Cedarview Terrace
- 134 N Oakwood Terrace
- 5700 E Tangelo Ln
- 5685 E Live Oak Ln
- 5535 E Live Oak Ln