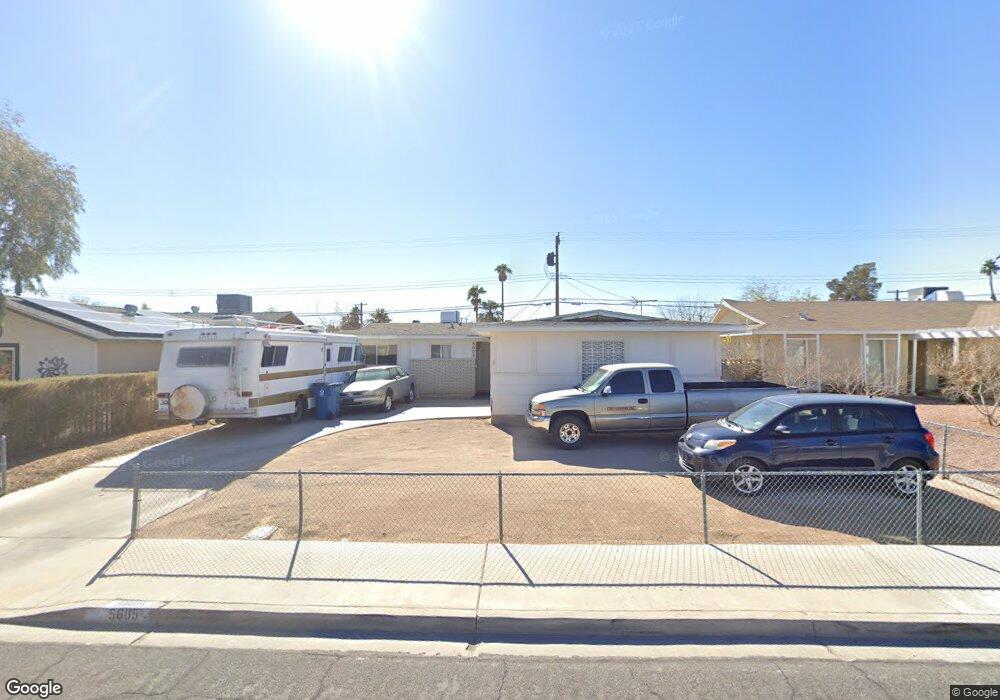
5605 Eugene Ave Las Vegas, NV 89108
Michael Way NeighborhoodEstimated Value: $325,452 - $355,000
3
Beds
2
Baths
1,176
Sq Ft
$286/Sq Ft
Est. Value
About This Home
This home is located at 5605 Eugene Ave, Las Vegas, NV 89108 and is currently estimated at $336,863, approximately $286 per square foot. 5605 Eugene Ave is a home located in Clark County with nearby schools including Bertha Ronzone Elementary School, J. Harold Brinley Middle School, and Western High School.
Ownership History
Date
Name
Owned For
Owner Type
Purchase Details
Closed on
Feb 6, 2013
Sold by
Neely Buford F
Bought by
Neely Buford F
Current Estimated Value
Purchase Details
Closed on
Sep 5, 2001
Sold by
Neely Buford F and Neely Dorothy P
Bought by
Neely Buford F and Neely Dorothy P
Create a Home Valuation Report for This Property
The Home Valuation Report is an in-depth analysis detailing your home's value as well as a comparison with similar homes in the area
Home Values in the Area
Average Home Value in this Area
Purchase History
| Date | Buyer | Sale Price | Title Company |
|---|---|---|---|
| Neely Buford F | -- | None Available | |
| Neely Buford F | -- | -- |
Source: Public Records
Tax History Compared to Growth
Tax History
| Year | Tax Paid | Tax Assessment Tax Assessment Total Assessment is a certain percentage of the fair market value that is determined by local assessors to be the total taxable value of land and additions on the property. | Land | Improvement |
|---|---|---|---|---|
| 2025 | $863 | $45,935 | $28,350 | $17,585 |
| 2024 | $863 | $45,935 | $28,350 | $17,585 |
| 2023 | $863 | $47,325 | $31,500 | $15,825 |
| 2022 | $799 | $40,077 | $25,900 | $14,177 |
| 2021 | $740 | $37,311 | $24,150 | $13,161 |
| 2020 | $684 | $34,147 | $21,350 | $12,797 |
| 2019 | $641 | $30,548 | $18,200 | $12,348 |
| 2018 | $612 | $27,704 | $16,100 | $11,604 |
| 2017 | $870 | $26,548 | $15,050 | $11,498 |
| 2016 | $574 | $21,603 | $10,500 | $11,103 |
| 2015 | $572 | $18,822 | $8,050 | $10,772 |
| 2014 | $554 | $16,398 | $5,250 | $11,148 |
Source: Public Records
Map
Nearby Homes
- 5600 Balzar Ave
- 5604 Reiter Ave
- 2132 Jeanne Dr
- 5601 W Bartlett Ave
- 2129 N Michael Way
- 5600 W Bartlett Ave
- 5521 Auborn Ave
- 2341 Canfield Dr Unit B
- 2349 Cardiff Ln Unit B
- 2373 Cardiff Ln Unit B
- 5701 Smoke Ranch Rd Unit D
- 2334 N Michael Way
- 3300 Michael Way
- 5817 Smoke Ranch Rd Unit B
- 5705 Stallion Ave
- 5917 Smoke Ranch Rd Unit B
- 5905 Smoke Ranch Rd Unit A
- 1864 Shadow Mountain Place
- 5424 Geneive Ln Unit 105
- 5424 Geneive Ln Unit 101
- 5609 Eugene Ave
- 5601 Eugene Ave
- 2128 Shadow Mountain Place
- 2125 Shadow Mountain Place
- 5613 Eugene Ave
- 5521 Eugene Ave
- 5608 Eugene Ave
- 5612 Eugene Ave
- 5604 Eugene Ave
- 2121 Shadow Mountain Place
- 5617 Eugene Ave
- 5616 Eugene Ave
- 5517 Eugene Ave
- 2124 Shadow Mountain Place
- 2125 Helen Ave
- 2129 Helen Ave
- 5620 Eugene Ave
- 5621 Eugene Ave
- 2124 Fuller Rd