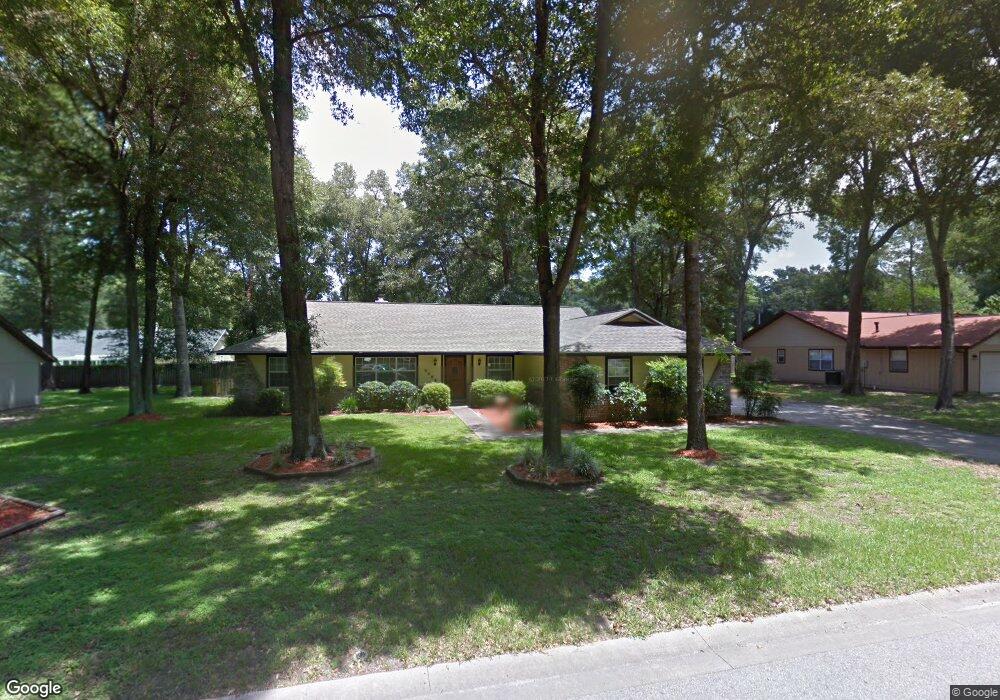
5605 SE 35th St Ocala, FL 34480
Silver Spring Shores NeighborhoodEstimated Value: $295,905 - $371,000
3
Beds
2
Baths
1,876
Sq Ft
$178/Sq Ft
Est. Value
About This Home
This home is located at 5605 SE 35th St, Ocala, FL 34480 and is currently estimated at $333,726, approximately $177 per square foot. 5605 SE 35th St is a home located in Marion County with nearby schools including Maplewood Elementary School, Osceola Middle School, and Forest High School.
Ownership History
Date
Name
Owned For
Owner Type
Purchase Details
Closed on
Mar 22, 2018
Sold by
Ross Jeff and Ross Toni L
Bought by
Ross Jeff and Ross Toni L
Current Estimated Value
Purchase Details
Closed on
Mar 27, 2001
Sold by
Hargabus George J
Bought by
Ross Jeff and Ross Toni L
Home Financials for this Owner
Home Financials are based on the most recent Mortgage that was taken out on this home.
Original Mortgage
$92,800
Interest Rate
7.02%
Create a Home Valuation Report for This Property
The Home Valuation Report is an in-depth analysis detailing your home's value as well as a comparison with similar homes in the area
Home Values in the Area
Average Home Value in this Area
Purchase History
| Date | Buyer | Sale Price | Title Company |
|---|---|---|---|
| Ross Jeff | -- | Attorney | |
| Ross Jeff | $116,000 | Ocala Land Title Insurance A | |
| Ross Jeff | $116,000 | Ocala Land Title Insurance A |
Source: Public Records
Mortgage History
| Date | Status | Borrower | Loan Amount |
|---|---|---|---|
| Previous Owner | Ross Jeff | $92,800 |
Source: Public Records
Tax History
| Year | Tax Paid | Tax Assessment Tax Assessment Total Assessment is a certain percentage of the fair market value that is determined by local assessors to be the total taxable value of land and additions on the property. | Land | Improvement |
|---|---|---|---|---|
| 2025 | $1,799 | $123,846 | -- | -- |
| 2024 | $1,559 | $120,356 | -- | -- |
| 2023 | $1,559 | $116,850 | -- | -- |
| 2022 | $1,468 | $113,447 | $0 | $0 |
| 2021 | $1,459 | $110,143 | $0 | $0 |
| 2020 | $1,444 | $108,622 | $0 | $0 |
| 2019 | $1,418 | $106,180 | $0 | $0 |
| 2018 | $1,349 | $104,200 | $0 | $0 |
| 2017 | $1,323 | $102,057 | $0 | $0 |
| 2016 | $1,288 | $99,958 | $0 | $0 |
| 2015 | $1,291 | $99,263 | $0 | $0 |
| 2014 | $1,214 | $98,475 | $0 | $0 |
Source: Public Records
Map
Nearby Homes
- 3295 SE 56th Ave
- 3465 SE 54th Ave
- 4 Banyan Dr
- 3883 SE 55th Ct
- 3901 SE 56th Ave
- 5297 SE 39th Loop
- 5425 SE 30th Place
- 3050 SE 53rd Ct
- 4041 SE 56th Terrace
- 3223 SE 52nd Ave
- 5355 SE 29th Place
- 5425 SE 28th Ln
- 5320 SE 28th Ln
- 5073 SE 39th Loop
- 5200 SE 31st St Unit 1-4
- 5305 SE 28th Ln
- 5305 SE 28th Ln Unit ALL UNITS
- 5601 SE 28th St
- 5360 SE 28th St
- 6 Almond Course
- 5621 SE 35th St
- 5598 SE 34th St
- 5570 SE 34th St
- 3500 SE 56th Ave
- 5630 SE 34th St
- 5570 SE 35th St
- 5541 SE 35th St
- 5641 SE 35th St
- 5550 SE 34th St
- 5650 SE 34th St
- 3481 SE 55th Ct
- 3505 SE 56th Ave
- 3540 SE 56th Ave
- 3490 SE 55th Ct
- 3535 SE 55th Ct
- 3490 SE 55 Ct
- 3390 SE 56th Ave
- 5635 SE 34th St
- 3500 SE 55th Ct
- 5530 SE 34th St
Your Personal Tour Guide
Ask me questions while you tour the home.