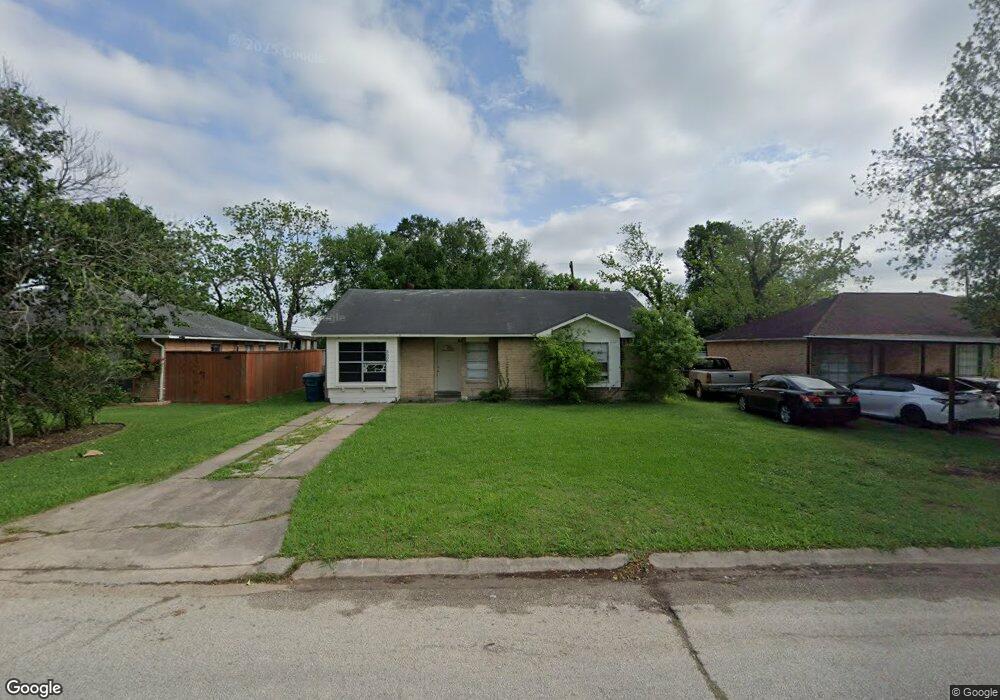
5606 Maywood Dr Houston, TX 77053
Fort Bend Houston NeighborhoodEstimated Value: $189,000 - $209,000
3
Beds
2
Baths
1
Sq Ft
$198,919/Sq Ft
Est. Value
About This Home
This home is located at 5606 Maywood Dr, Houston, TX 77053 and is currently estimated at $198,919, approximately $198,919 per square foot. 5606 Maywood Dr is a home located in Fort Bend County with nearby schools including Ridgegate Elementary School, Christa McAuliffe Middle School, and Willowridge High School.
Ownership History
Date
Name
Owned For
Owner Type
Purchase Details
Closed on
Nov 17, 2023
Sold by
Pclo Loc Llc
Bought by
Pclo 111123 Llc
Current Estimated Value
Home Financials for this Owner
Home Financials are based on the most recent Mortgage that was taken out on this home.
Original Mortgage
$10,940,242
Outstanding Balance
$9,503,687
Interest Rate
7.63%
Mortgage Type
New Conventional
Estimated Equity
-$9,304,768
Purchase Details
Closed on
Jun 29, 2022
Sold by
Q Resorts Llc
Bought by
Pclo Loc Llc
Home Financials for this Owner
Home Financials are based on the most recent Mortgage that was taken out on this home.
Original Mortgage
$13,605,023
Interest Rate
5.1%
Mortgage Type
Construction
Purchase Details
Closed on
Feb 1, 2017
Sold by
Re Jen Teo Llc
Bought by
Rio Robles Ventures Llc
Purchase Details
Closed on
Aug 1, 2011
Sold by
Jenkins Loren L
Bought by
Rio Robles Ventures Llc
Purchase Details
Closed on
Dec 12, 1994
Sold by
Diaz Lydia
Bought by
Jenkins Loren L
Create a Home Valuation Report for This Property
The Home Valuation Report is an in-depth analysis detailing your home's value as well as a comparison with similar homes in the area
Home Values in the Area
Average Home Value in this Area
Purchase History
| Date | Buyer | Sale Price | Title Company |
|---|---|---|---|
| Pclo 111123 Llc | -- | None Listed On Document | |
| Pclo Loc Llc | -- | Frontier Title Company | |
| Q Resorts Llc | -- | Frontier Title Company | |
| Rio Robles Ventures Llc | -- | None Available | |
| Rio Robles Ventures Llc | -- | -- | |
| Rio Robles Ventures Llc | -- | -- | |
| Jenkins Loren L | -- | -- |
Source: Public Records
Mortgage History
| Date | Status | Borrower | Loan Amount |
|---|---|---|---|
| Open | Pclo 111123 Llc | $10,940,242 | |
| Previous Owner | Pclo Loc Llc | $13,605,023 |
Source: Public Records
Tax History Compared to Growth
Tax History
| Year | Tax Paid | Tax Assessment Tax Assessment Total Assessment is a certain percentage of the fair market value that is determined by local assessors to be the total taxable value of land and additions on the property. | Land | Improvement |
|---|---|---|---|---|
| 2025 | $3,479 | $141,575 | $21,840 | $119,735 |
| 2024 | $3,479 | $180,462 | $21,840 | $158,622 |
| 2023 | $3,479 | $179,854 | $16,800 | $163,054 |
| 2022 | $3,024 | $142,700 | $16,800 | $125,900 |
| 2021 | $2,555 | $115,410 | $16,800 | $98,610 |
| 2020 | $2,522 | $111,830 | $14,000 | $97,830 |
| 2019 | $2,150 | $90,620 | $14,000 | $76,620 |
| 2018 | $2,094 | $88,250 | $14,000 | $74,250 |
| 2017 | $1,906 | $79,420 | $14,000 | $65,420 |
| 2016 | $1,719 | $71,610 | $14,000 | $57,610 |
| 2015 | $1,318 | $72,200 | $14,000 | $58,200 |
| 2014 | $1,094 | $59,610 | $14,000 | $45,610 |
Source: Public Records
Map
Nearby Homes
- 5605 Melanite Ave
- 5734 Arthington St
- 5418 Arthington St
- 15903 Lenclaire Dr
- 15915 Dante Dr
- 5614 Condon Ln
- 5710 W Ridgecreek Dr
- 6101 Maywood Dr
- 5310 Ingomar Way
- 15406 Markwood Ct
- 5774 Gineridge Dr
- 5619 Gineridge Dr
- 15318 Corsair Rd
- 15806 Corsair Rd
- 5622 Lycomb Dr
- 5310 Ridgeton Dr
- 5121 Mackinaw St
- 16226 Alden Ridge Dr
- 5118 Danfield Dr
- 6018 Beaconridge Dr
- 5610 Maywood Dr
- 5602 Maywood Dr
- 5605 Arthington St
- 5614 Maywood Dr
- 5538 Maywood Dr
- 5609 Arthington St
- 5601 Arthington St
- 5613 Arthington St
- 5607 Maywood Dr
- 5537 Arthington St
- 5603 Maywood Dr
- 5611 Maywood Dr
- 5618 Maywood Dr
- 5534 Maywood Dr
- 5539 Maywood Dr
- 5615 Maywood Dr
- 5617 Arthington St
- 5533 Arthington St
- 5622 Maywood Dr
- 5530 Maywood Dr