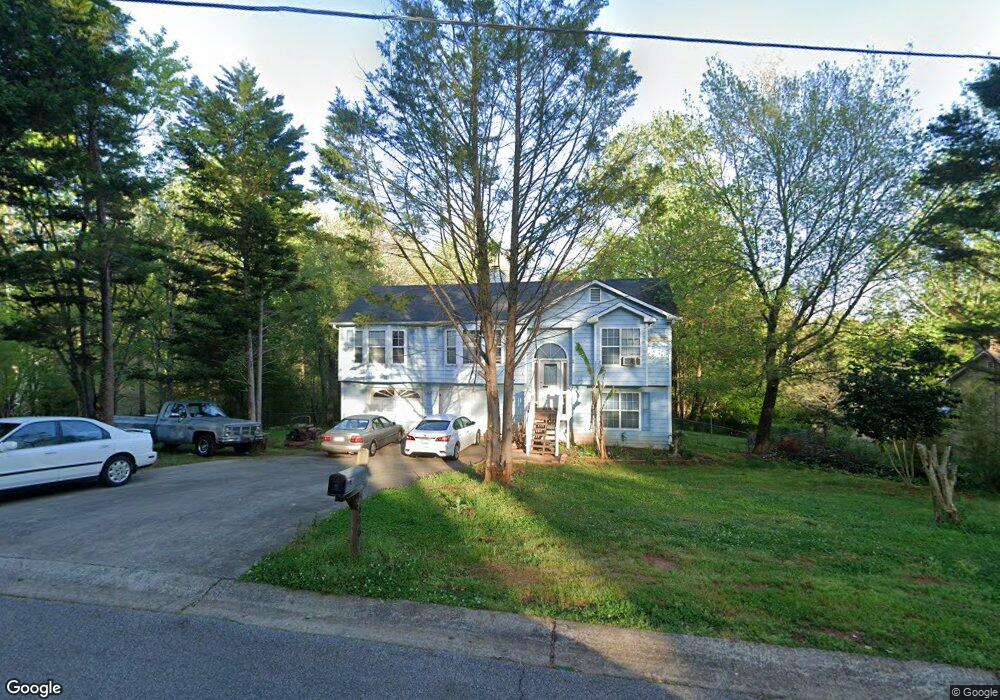
5606 Ryan Way Flowery Branch, GA 30542
Southeast Gainesville NeighborhoodEstimated Value: $328,000 - $358,392
3
Beds
3
Baths
1,307
Sq Ft
$264/Sq Ft
Est. Value
About This Home
This home is located at 5606 Ryan Way, Flowery Branch, GA 30542 and is currently estimated at $345,348, approximately $264 per square foot. 5606 Ryan Way is a home located in Hall County with nearby schools including Spout Springs Elementary School, Cherokee Bluff Middle School, and Cherokee Bluff High School.
Ownership History
Date
Name
Owned For
Owner Type
Purchase Details
Closed on
Jan 19, 2024
Sold by
Salgado J Felix
Bought by
Jimenez Juan and Amaya Juana
Current Estimated Value
Purchase Details
Closed on
Aug 17, 2001
Sold by
Salyer Anthony C and Salyer Patricia M
Bought by
Salgado J Felix
Home Financials for this Owner
Home Financials are based on the most recent Mortgage that was taken out on this home.
Original Mortgage
$128,400
Interest Rate
7.18%
Mortgage Type
FHA
Purchase Details
Closed on
Jul 14, 1994
Sold by
Jcg Inc
Bought by
Salyer Anthony Patricia
Home Financials for this Owner
Home Financials are based on the most recent Mortgage that was taken out on this home.
Original Mortgage
$67,450
Interest Rate
8.26%
Purchase Details
Closed on
May 1, 1994
Create a Home Valuation Report for This Property
The Home Valuation Report is an in-depth analysis detailing your home's value as well as a comparison with similar homes in the area
Home Values in the Area
Average Home Value in this Area
Purchase History
| Date | Buyer | Sale Price | Title Company |
|---|---|---|---|
| Jimenez Juan | -- | -- | |
| Salgado Alberto Ezequiel | -- | -- | |
| Salgado J Felix | $130,500 | -- | |
| Salyer Anthony Patricia | $84,400 | -- | |
| -- | $15,500 | -- |
Source: Public Records
Mortgage History
| Date | Status | Borrower | Loan Amount |
|---|---|---|---|
| Previous Owner | Salgado J Felix | $128,400 | |
| Previous Owner | Salyer Anthony Patricia | $67,450 |
Source: Public Records
Tax History
| Year | Tax Paid | Tax Assessment Tax Assessment Total Assessment is a certain percentage of the fair market value that is determined by local assessors to be the total taxable value of land and additions on the property. | Land | Improvement |
|---|---|---|---|---|
| 2025 | $3,254 | $137,640 | $28,000 | $109,640 |
| 2024 | $3,335 | $134,080 | $28,000 | $106,080 |
| 2023 | $3,214 | $145,000 | $28,000 | $117,000 |
| 2022 | $2,302 | $88,520 | $13,320 | $75,200 |
| 2021 | $2,141 | $80,800 | $13,320 | $67,480 |
| 2020 | $2,118 | $77,680 | $13,320 | $64,360 |
| 2019 | $2,091 | $76,000 | $13,320 | $62,680 |
| 2018 | $1,696 | $59,600 | $9,040 | $50,560 |
| 2017 | $1,514 | $53,680 | $9,040 | $44,640 |
| 2016 | $1,421 | $51,560 | $9,040 | $42,520 |
| 2015 | $1,341 | $48,219 | $7,160 | $41,059 |
| 2014 | $1,341 | $48,219 | $7,160 | $41,059 |
Source: Public Records
Map
Nearby Homes
- 5564 Elderberry Ln
- 7423 Rocklin Ln
- 7332 Rocklin Ln
- 6670 Spout Springs Rd
- 7255 Millbrae Walk
- 7367 Rocklin Ln
- 7236 Millbrae Walk
- 7272 Millbrae Walk
- 6870 Kate Ln
- 7232 Millbrae Walk
- 7224 Millbrae Walk
- 7260 Millbrae Walk
- 7375 Rocklin Ln
- 7415 Rocklin Ln
- 6928 Manchester Dr
- 6809 Benjamin Dr
- 7428 Rocklin Ln
- 6833 Benjamin Dr
- 6940 Manchester Dr
- 6898 Lancaster Crossing
- 5561 Elderberry Ln
- 5614 Ryan Way
- 5571 Elderberry Ln
- 5605 Ryan Way
- 5613 Ryan Way
- 5620 Ryan Way
- 5547 Elderberry Ln
- 5560 Elderberry Ln
- 5575 Elderberry Ln
- 5556 Elderberry Ln
- 5609 Ryan Way
- 5621 Ryan Way
- 5617 Ryan Way
- 5552 Elderberry Ln
- 5568 Elderberry Ln
- 5572 Elderberry Ln
- 5548 Elderberry Ln Unit 12
- 5548 Elderberry Ln
- 5625 Ryan Way
- 5576 Elderberry Ln
Your Personal Tour Guide
Ask me questions while you tour the home.