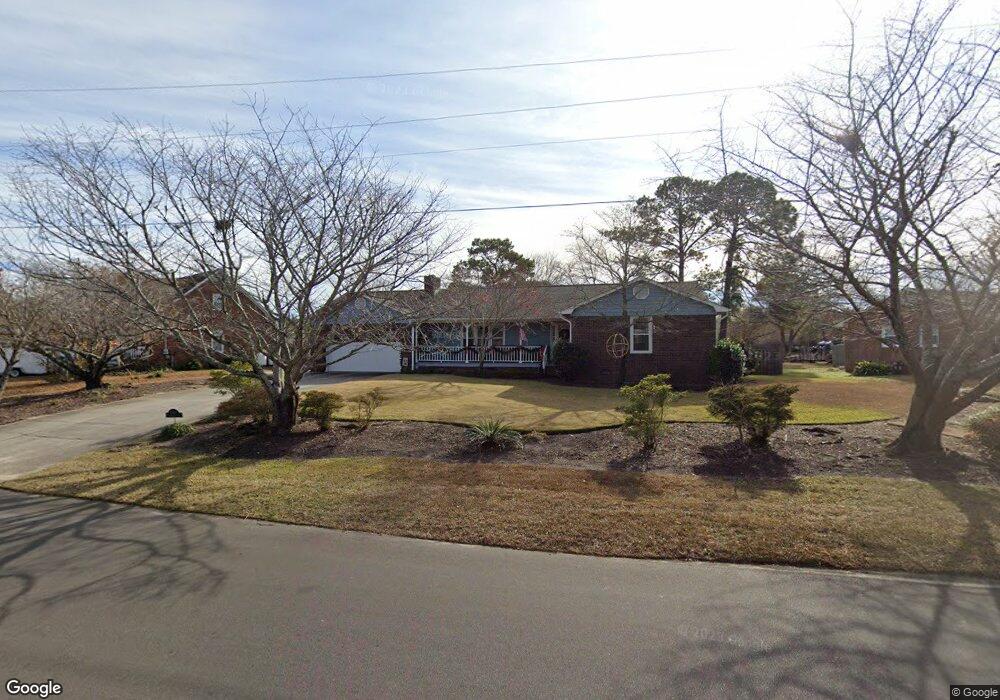
5607 Woodduck Cir Wilmington, NC 28409
Estimated Value: $434,000 - $450,000
3
Beds
3
Baths
1,790
Sq Ft
$247/Sq Ft
Est. Value
About This Home
This home is located at 5607 Woodduck Cir, Wilmington, NC 28409 and is currently estimated at $442,731, approximately $247 per square foot. 5607 Woodduck Cir is a home located in New Hanover County with nearby schools including Heyward C. Bellamy Elementary School, Myrtle Grove Middle School, and Eugene Ashley High School.
Ownership History
Date
Name
Owned For
Owner Type
Purchase Details
Closed on
Mar 31, 2023
Sold by
Cox Edward Leroy
Bought by
Cox Roxie Z
Current Estimated Value
Purchase Details
Closed on
Aug 29, 2017
Sold by
Massey Carolyn Jordan
Bought by
Cox Edward Leroy and Cox Roxie X
Purchase Details
Closed on
Nov 28, 2000
Sold by
Caulder Trudy
Bought by
Massey Philip E Carolyn J
Purchase Details
Closed on
Jul 10, 2000
Sold by
Caulder James L
Bought by
Caulder Trudy
Purchase Details
Closed on
Jun 10, 1998
Sold by
Sanderson Helen B James W
Bought by
Caulder James L Trudy
Purchase Details
Closed on
Dec 24, 1996
Sold by
Sheets Bill Franklyn
Bought by
Sheets Helen B
Purchase Details
Closed on
Oct 3, 1994
Sold by
Emmart William T Trustee
Bought by
Sheets Bill F Helen B
Purchase Details
Closed on
Jun 1, 1984
Sold by
Howell Charles R Jr Judit
Bought by
Sheets Bill F Helen B
Purchase Details
Closed on
Apr 1, 1969
Bought by
Emmart M S Jr W T
Create a Home Valuation Report for This Property
The Home Valuation Report is an in-depth analysis detailing your home's value as well as a comparison with similar homes in the area
Home Values in the Area
Average Home Value in this Area
Purchase History
| Date | Buyer | Sale Price | Title Company |
|---|---|---|---|
| Cox Roxie Z | -- | None Listed On Document | |
| Cox Edward Leroy | $220,000 | None Available | |
| Massey Philip E Carolyn J | $131,500 | -- | |
| Caulder Trudy | -- | -- | |
| Caulder James L Trudy | $134,500 | -- | |
| Sheets Helen B | -- | -- | |
| Sheets Bill F Helen B | -- | -- | |
| Sheets Bill F Helen B | $91,500 | -- | |
| Howell Charles R Jr Judit | -- | -- | |
| Emmart M S Jr W T | -- | -- |
Source: Public Records
Tax History Compared to Growth
Tax History
| Year | Tax Paid | Tax Assessment Tax Assessment Total Assessment is a certain percentage of the fair market value that is determined by local assessors to be the total taxable value of land and additions on the property. | Land | Improvement |
|---|---|---|---|---|
| 2025 | $1,504 | $467,700 | $128,200 | $339,500 |
| 2023 | $1,504 | $273,700 | $80,600 | $193,100 |
| 2022 | $1,512 | $273,700 | $80,600 | $193,100 |
| 2021 | $1,511 | $273,700 | $80,600 | $193,100 |
| 2020 | $1,408 | $222,600 | $55,000 | $167,600 |
| 2019 | $1,408 | $209,900 | $55,000 | $154,900 |
| 2018 | $1,328 | $209,900 | $55,000 | $154,900 |
| 2017 | $1,359 | $209,900 | $55,000 | $154,900 |
| 2016 | $1,211 | $174,800 | $55,000 | $119,800 |
| 2015 | $1,126 | $174,800 | $55,000 | $119,800 |
| 2014 | $1,106 | $174,800 | $55,000 | $119,800 |
Source: Public Records
Map
Nearby Homes
- 324 Foxwood Ln
- 301 Foxwood Ln
- 5705 Woodduck Cir
- 273 Foxwood Ln
- 4922 Woods Edge Rd
- 5500 N Warrendale Ct
- 704 Mallard Crossing Dr
- 5028 Laurenbridge Ln
- 5304 Masonboro Loop Rd
- 4809 W Grove Dr
- 5029 Woods Edge Rd
- 4829 Wedgefield Dr
- 4728 Wedgefield Dr
- 653 Hidden Valley Rd
- 234 Brighton Rd
- 633 Piner Rd
- 5200 Woods Edge Rd
- 1202 Beresford Ct
- 1221 S Beresford Ct
- 201 Southwold Dr
- 5607 Wood Duck Cir
- 5611 Woodduck Cir
- 5595 Wood Duck Cir
- 5595 Woodduck Cir
- 730 Emmarts Ct
- 745 Billmark Dr
- 5591 Woodduck Cir
- 5598 Woodduck Cir
- 5594 Woodduck Cir
- 5594 Wood Duck Cir
- 5610 Woodduck Cir
- 5615 Woodduck Cir
- 5615 Wood Duck Cir
- 749 Billmark Dr
- 5587 Woodduck Cir
- 5614 Woodduck Cir
- 5590 Woodduck Cir
- 746 Billmark Dr
- 5583 Woodduck Cir
- 725 Emmarts Ct