5609 S 232nd St Unit 1-1 Kent, WA 98032
The Lakes NeighborhoodEstimated Value: $440,000 - $447,000
3
Beds
3
Baths
1,242
Sq Ft
$357/Sq Ft
Est. Value
About This Home
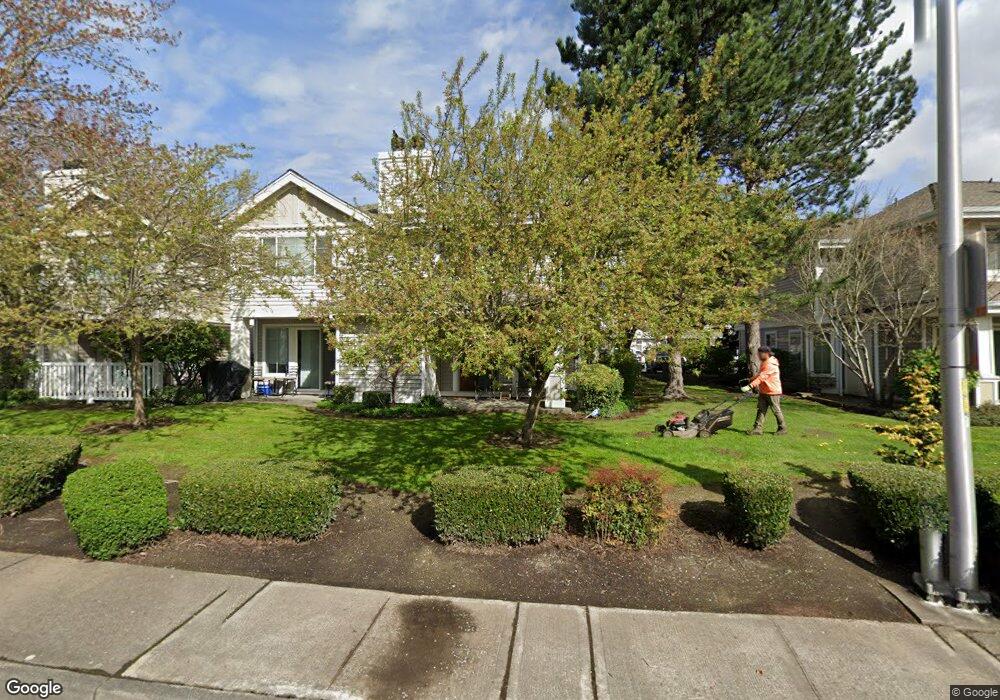
This home is located at 5609 S 232nd St Unit 1-1, Kent, WA 98032 and is currently estimated at $443,864, approximately $357 per square foot. 5609 S 232nd St Unit 1-1 is a home located in King County with nearby schools including Neely O Brien Elementary School, Mill Creek Middle School, and Kent-Meridian High School.
Ownership History
Date
Name
Owned For
Owner Type
Purchase Details
Closed on
Jul 26, 2006
Sold by
Bautista Emily L
Bought by
Kamelman Rafik S and Kamelman Dena W
Current Estimated Value
Home Financials for this Owner
Home Financials are based on the most recent Mortgage that was taken out on this home.
Original Mortgage
$193,600
Outstanding Balance
$112,335
Interest Rate
6.15%
Estimated Equity
$331,529
Purchase Details
Closed on
May 2, 2000
Sold by
Taylor Alisa D
Bought by
Bautista Alfred D and Bautista Emily L
Home Financials for this Owner
Home Financials are based on the most recent Mortgage that was taken out on this home.
Original Mortgage
$123,200
Interest Rate
9.62%
Purchase Details
Closed on
Dec 4, 1997
Sold by
Village Ii Llc
Bought by
Taylor Alisa M
Home Financials for this Owner
Home Financials are based on the most recent Mortgage that was taken out on this home.
Original Mortgage
$124,600
Interest Rate
7.31%
Create a Home Valuation Report for This Property
The Home Valuation Report is an in-depth analysis detailing your home's value as well as a comparison with similar homes in the area
Home Values in the Area
Average Home Value in this Area
Purchase History
| Date | Buyer | Sale Price | Title Company |
|---|---|---|---|
| Kamelman Rafik S | $242,000 | Old Republic T | |
| Bautista Alfred D | $154,000 | Transnation Title Insurance | |
| Taylor Alisa M | $128,878 | Chicago Title Ins Co |
Source: Public Records
Mortgage History
| Date | Status | Borrower | Loan Amount |
|---|---|---|---|
| Open | Kamelman Rafik S | $193,600 | |
| Previous Owner | Bautista Alfred D | $123,200 | |
| Previous Owner | Taylor Alisa M | $124,600 | |
| Closed | Bautista Alfred D | $123,200 |
Source: Public Records
Tax History Compared to Growth
Tax History
| Year | Tax Paid | Tax Assessment Tax Assessment Total Assessment is a certain percentage of the fair market value that is determined by local assessors to be the total taxable value of land and additions on the property. | Land | Improvement |
|---|---|---|---|---|
| 2024 | $4,261 | $411,000 | $39,100 | $371,900 |
| 2023 | $3,854 | $417,000 | $37,200 | $379,800 |
| 2022 | $3,509 | $359,000 | $37,200 | $321,800 |
| 2021 | $3,401 | $292,000 | $35,400 | $256,600 |
| 2020 | $3,350 | $270,000 | $35,400 | $234,600 |
| 2018 | $2,916 | $263,000 | $29,900 | $233,100 |
| 2017 | $2,421 | $218,000 | $29,900 | $188,100 |
| 2016 | $2,278 | $183,000 | $29,900 | $153,100 |
| 2015 | $2,019 | $163,000 | $29,900 | $133,100 |
| 2014 | -- | $140,000 | $29,900 | $110,100 |
| 2013 | -- | $101,000 | $35,800 | $65,200 |
Source: Public Records
Map
Nearby Homes
- 23420 54th Ave S Unit 25-1
- 23512 55th Ave S Unit 16
- 23331 59th Place S Unit 16-4
- 5812 S 234th St
- 23606 55th Ave S Unit 11-03
- 23228 59th Ct S
- 5403 S 236th St Unit 2
- 5319 S 236th St Unit 6
- 23425 51st Ave S
- 6119 S 233rd St Unit 19-6
- 5509 S 237th Place Unit 12-3
- 23402 62nd Ave S
- 4931 S 233rd Place Unit 27-1
- 5736 S 238th Ct Unit E4
- 23955 58th Ct S Unit E1
- 23959 58th Ct S Unit C-1
- 22715 43rd Ave S Unit 101
- 22607 42nd Place S Unit 13
- 22617 42nd Place S Unit 23
- 6706 S 239th Place Unit E103
- 5607 S 232nd St
- 5605 S 232nd St
- 5621 S 232nd St
- 5627 S 232nd St
- 5612 S 232nd St
- 5610 S 232nd St
- 5610 S 232nd St Unit 6-1
- 23130 56th Ave S
- 23130 56th Ave S Unit 7-7-2
- 5616 S 232nd St
- 5616 S 232nd St Unit 6-4
- 23211 56th Ave S Unit X
- 23211 56th Ave S
- 23203 56th Ave S Unit 13-3
- 23203 56th Ave S
- 23209 56th Ave S Unit 13-2
- 5608 S 233rd St
- 5620 S 233rd St
- 5604 S 233rd St Unit 5
- 5604 S 233rd St