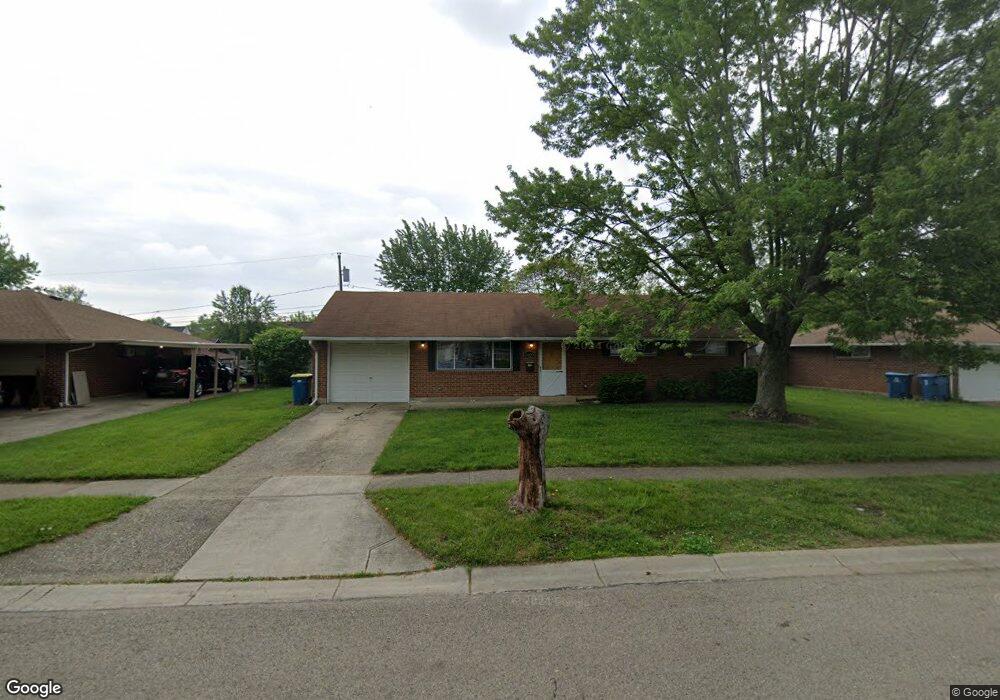
5609 Shady Oak St Dayton, OH 45424
Estimated Value: $151,000 - $200,000
3
Beds
2
Baths
1,080
Sq Ft
$166/Sq Ft
Est. Value
About This Home
This home is located at 5609 Shady Oak St, Dayton, OH 45424 and is currently estimated at $179,058, approximately $165 per square foot. 5609 Shady Oak St is a home located in Montgomery County with nearby schools including Wayne High School and Huber Heights Christian Academy.
Ownership History
Date
Name
Owned For
Owner Type
Purchase Details
Closed on
Nov 1, 2018
Sold by
Vbannex B Borrower Llc
Bought by
Nrea Vb Iii Llc
Current Estimated Value
Purchase Details
Closed on
Feb 13, 2017
Sold by
Vinebrook Annex B Ohio Llc
Bought by
Vbannex B Borrower Llc
Home Financials for this Owner
Home Financials are based on the most recent Mortgage that was taken out on this home.
Original Mortgage
$75,000
Interest Rate
4.12%
Mortgage Type
Construction
Purchase Details
Closed on
Nov 10, 2015
Sold by
The Cornell Group Llc
Bought by
Vinebrook Annex B Ohio Llc
Purchase Details
Closed on
Mar 28, 2012
Sold by
Ohio Investments Llc
Bought by
The Cornell Group Llc
Purchase Details
Closed on
Feb 9, 2012
Sold by
The Secretary Of Hud
Bought by
Ohio Investments Llc
Purchase Details
Closed on
Jun 30, 2011
Sold by
Logel Eric L and Logel Kathy J
Bought by
U S Bank N A
Purchase Details
Closed on
Sep 28, 1999
Sold by
Simon William A and Simon Joann Y
Bought by
Logel Eric L and Logel Kathy J
Home Financials for this Owner
Home Financials are based on the most recent Mortgage that was taken out on this home.
Original Mortgage
$69,495
Interest Rate
7.83%
Mortgage Type
FHA
Create a Home Valuation Report for This Property
The Home Valuation Report is an in-depth analysis detailing your home's value as well as a comparison with similar homes in the area
Home Values in the Area
Average Home Value in this Area
Purchase History
| Date | Buyer | Sale Price | Title Company |
|---|---|---|---|
| Nrea Vb Iii Llc | -- | Os National Llc | |
| Vbannex B Borrower Llc | -- | None Available | |
| Vinebrook Annex B Ohio Llc | $57,300 | Attorney | |
| The Cornell Group Llc | -- | None Available | |
| Ohio Investments Llc | $26,543 | None Available | |
| U S Bank N A | $48,000 | None Available | |
| Logel Eric L | $69,900 | First Central Land Title Age |
Source: Public Records
Mortgage History
| Date | Status | Borrower | Loan Amount |
|---|---|---|---|
| Previous Owner | Vbannex B Borrower Llc | $75,000 | |
| Previous Owner | Logel Eric L | $69,495 |
Source: Public Records
Tax History Compared to Growth
Tax History
| Year | Tax Paid | Tax Assessment Tax Assessment Total Assessment is a certain percentage of the fair market value that is determined by local assessors to be the total taxable value of land and additions on the property. | Land | Improvement |
|---|---|---|---|---|
| 2024 | $2,324 | $43,840 | $10,010 | $33,830 |
| 2023 | $2,324 | $43,840 | $10,010 | $33,830 |
| 2022 | $2,060 | $30,640 | $7,000 | $23,640 |
| 2021 | $2,090 | $30,640 | $7,000 | $23,640 |
| 2020 | $2,092 | $30,640 | $7,000 | $23,640 |
| 2019 | $1,308 | $16,720 | $8,750 | $7,970 |
| 2018 | $1,313 | $16,720 | $8,750 | $7,970 |
| 2017 | $1,305 | $16,720 | $8,750 | $7,970 |
| 2016 | $1,367 | $14,860 | $8,750 | $6,110 |
| 2015 | $1,352 | $14,860 | $8,750 | $6,110 |
| 2014 | $1,352 | $14,860 | $8,750 | $6,110 |
| 2012 | -- | $14,910 | $8,750 | $6,160 |
Source: Public Records
Map
Nearby Homes
- 5630 Botkins Rd
- 5732 Benedict Rd
- 5474 Bellefontaine Rd Unit 5468
- 5685 Cottonwood Ct
- 5912 Bavaria Place
- 6620 Pheasant Ridge Rd
- 5333 Heather Way
- 6322 Ring Neck Dr
- Juniper with Finished Basement Plan at Heathermere Woods
- 4918 Powell Rd
- 6732 Grovebelle Dr
- 4061 Hemlock Ct
- 4067 Hemlock Ct
- 5455 Naughton Dr
- 6520 Marino
- 5455 Flotron Dr
- 6463 Ring Neck Dr
- 5431 Naughton Dr
- 6456 Pheasant Finch Dr
- 4848 Rittenhouse Dr
- 5601 Shady Oak St
- 5619 Shady Oak St
- 5656 Bergan Dr
- 5668 Bergan Dr
- 5629 Shady Oak St
- 5595 Shady Oak St
- 5612 Shady Oak St
- 5606 Broomall St
- 5650 Bergan Dr
- 5620 Shady Oak St
- 5589 Shady Oak St
- 5674 Bergan Dr
- 5644 Bergan Dr
- 5628 Shady Oak St
- 5607 Broomall St
- 5309 Powell Rd
- 5663 Bergan Dr
- 5600 Broomall St
- 5657 Bergan Dr
- 5317 Powell Rd