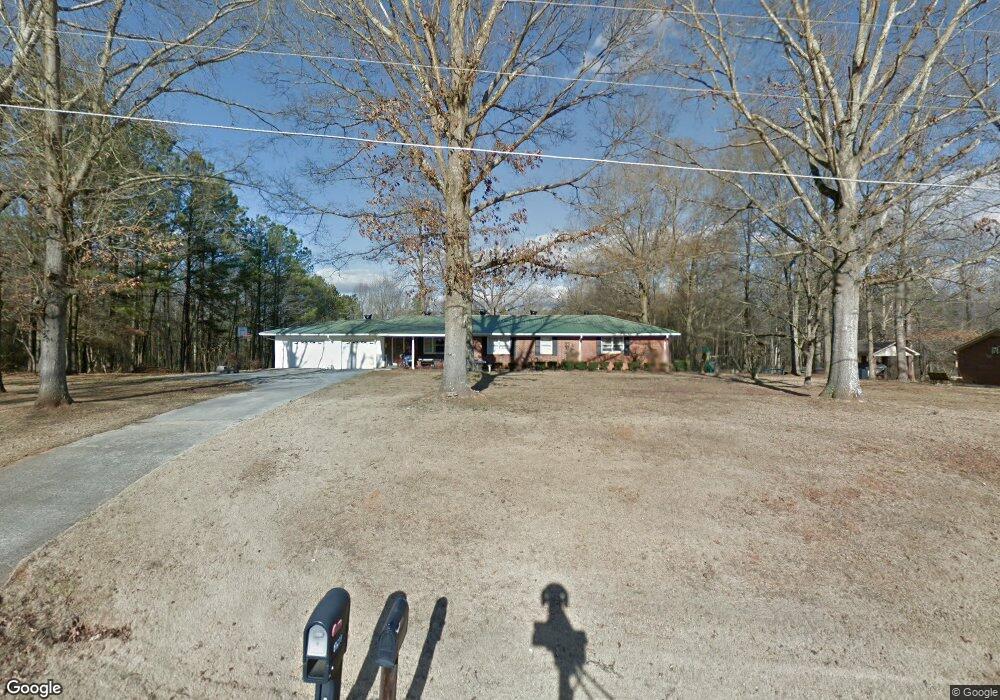
5609 Smithfield Rd Unit 2ac Bowdon, GA 30108
Estimated Value: $314,672 - $496,000
4
Beds
3
Baths
1,988
Sq Ft
$186/Sq Ft
Est. Value
About This Home
This home is located at 5609 Smithfield Rd Unit 2ac, Bowdon, GA 30108 and is currently estimated at $369,168, approximately $185 per square foot. 5609 Smithfield Rd Unit 2ac is a home located in Carroll County with nearby schools including Bowdon Elementary School, Bowdon Middle School, and Bowdon High School.
Ownership History
Date
Name
Owned For
Owner Type
Purchase Details
Closed on
Mar 31, 2021
Sold by
Bryant Brandon
Bought by
Husby Micah Leann and Husby John Robert
Current Estimated Value
Home Financials for this Owner
Home Financials are based on the most recent Mortgage that was taken out on this home.
Original Mortgage
$238,500
Outstanding Balance
$213,932
Interest Rate
3%
Mortgage Type
New Conventional
Estimated Equity
$155,236
Purchase Details
Closed on
Oct 14, 2016
Sold by
Styles Randel M and Styles Rick D
Bought by
Bryant Ashley and Bryant Brandon
Home Financials for this Owner
Home Financials are based on the most recent Mortgage that was taken out on this home.
Original Mortgage
$141,685
Interest Rate
3.37%
Mortgage Type
FHA
Purchase Details
Closed on
Jun 9, 1964
Bought by
Styles
Create a Home Valuation Report for This Property
The Home Valuation Report is an in-depth analysis detailing your home's value as well as a comparison with similar homes in the area
Home Values in the Area
Average Home Value in this Area
Purchase History
| Date | Buyer | Sale Price | Title Company |
|---|---|---|---|
| Husby Micah Leann | $265,000 | -- | |
| Bryant Ashley | $144,300 | -- | |
| Styles Randel Mark | -- | -- | |
| Styles | -- | -- |
Source: Public Records
Mortgage History
| Date | Status | Borrower | Loan Amount |
|---|---|---|---|
| Open | Husby Micah Leann | $238,500 | |
| Previous Owner | Styles Randel Mark | $141,685 |
Source: Public Records
Tax History
| Year | Tax Paid | Tax Assessment Tax Assessment Total Assessment is a certain percentage of the fair market value that is determined by local assessors to be the total taxable value of land and additions on the property. | Land | Improvement |
|---|---|---|---|---|
| 2025 | $1,795 | $91,850 | $12,097 | $79,753 |
| 2024 | $1,815 | $91,850 | $12,097 | $79,753 |
| 2023 | $1,831 | $82,303 | $9,678 | $72,625 |
| 2022 | $1,524 | $64,759 | $6,452 | $58,307 |
| 2021 | $1,199 | $55,307 | $5,162 | $50,145 |
| 2020 | $1,085 | $48,918 | $4,692 | $44,226 |
| 2019 | $1,037 | $45,806 | $4,692 | $41,114 |
| 2018 | $948 | $40,100 | $2,578 | $37,522 |
| 2017 | $951 | $40,100 | $2,578 | $37,522 |
| 2016 | $158 | $31,679 | $2,578 | $29,101 |
| 2015 | $160 | $26,957 | $3,752 | $23,206 |
| 2014 | $161 | $26,958 | $3,752 | $23,206 |
Source: Public Records
Map
Nearby Homes
- 183 Madden Rd
- 80 Hand Rd
- 695 Frost Rd
- 0 Kansas Jake Rd Unit 26132658
- 0 Kansas Jake Rd Unit 10676294
- 0 Kansas Jake Rd Unit 26114165
- 0 Kansas Jake Rd Unit 26114173
- 0 N Highway 100 Unit TRACT 2 10571032
- 0 N Highway 100 Unit TRACT 3 10571036
- 0 N Highway 100 Unit TRACT 4 10571038
- 1960 N Highway 100
- 257 N Carroll St
- 0 Lovvorn Mill Rd Unit 10707035
- 0 Lovvorn Mill Rd
- 247 Rome St
- Melear Rd
- 485 West Ave
- 6.41 ac N Carroll St & Ave W
- 427 E College St
- 407 E College St
- 5609 Smithfield Rd
- 5595 Smithfield Rd
- 5600 Smithfield Rd
- 5620 Smithfield Rd
- 5580 Smithfield Rd
- 5541 Smithfield Rd
- 5552 Smithfield Rd
- 1521 N Highway 100
- 1541 N Highway 100
- 1521 Georgia 100
- 1501 N Highway 100
- 1595 N Highway 100
- 1481 N Highway 100
- 1564 N Highway 100
- 1625 N Highway 100
- 1625 Georgia 100
- 5701 Smithfield Rd
- 1463 N Highway 100
- 11 Dogwood Ln
- 1506 N Highway 100
Your Personal Tour Guide
Ask me questions while you tour the home.