Estimated Value: $253,000 - $276,000
4
Beds
3
Baths
1,812
Sq Ft
$145/Sq Ft
Est. Value
About This Home
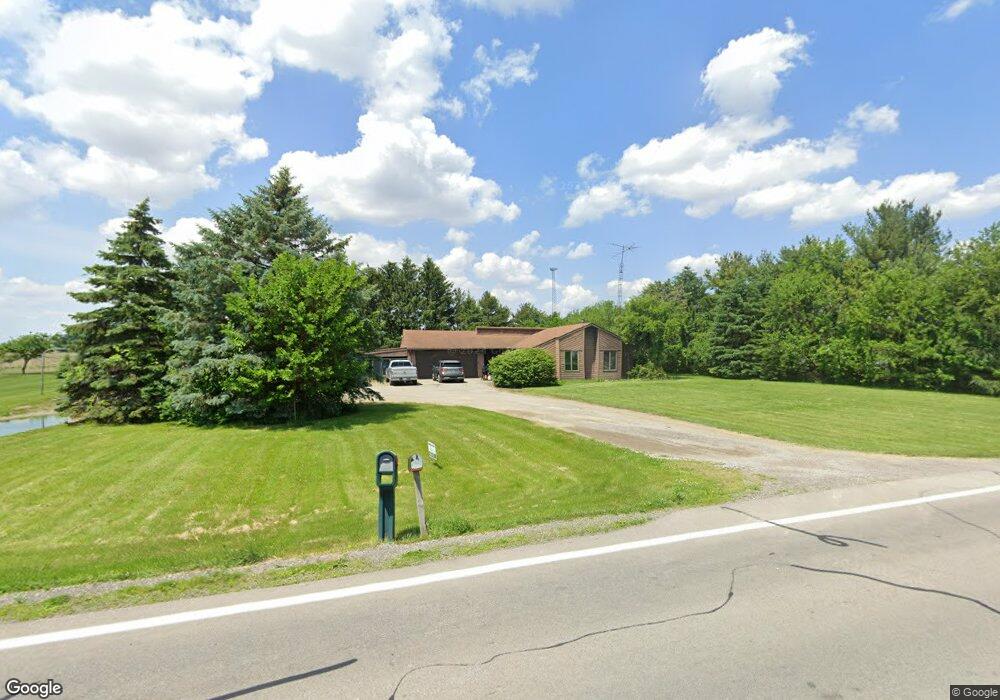
This home is located at 5609 State Route 109, Delta, OH 43515 and is currently estimated at $262,719, approximately $144 per square foot. 5609 State Route 109 is a home located in Fulton County with nearby schools including Delta Elementary School, Pike-Delta-York Middle School, and Pike-Delta-York High School.
Ownership History
Date
Name
Owned For
Owner Type
Purchase Details
Closed on
Jun 18, 2018
Sold by
Gormley Linda J and Snyder Linda J
Bought by
Widney Kimberly M and Widney Anthony J
Current Estimated Value
Home Financials for this Owner
Home Financials are based on the most recent Mortgage that was taken out on this home.
Original Mortgage
$166,250
Outstanding Balance
$143,778
Interest Rate
4.5%
Mortgage Type
New Conventional
Estimated Equity
$118,941
Purchase Details
Closed on
Oct 5, 1994
Sold by
Sharp Ervin W
Bought by
Snyder Lonnie A and Gormley Linda J
Home Financials for this Owner
Home Financials are based on the most recent Mortgage that was taken out on this home.
Original Mortgage
$90,000
Interest Rate
7.12%
Mortgage Type
New Conventional
Purchase Details
Closed on
Jan 1, 1990
Bought by
Snyder Lonnie A and Snyder Gormley
Create a Home Valuation Report for This Property
The Home Valuation Report is an in-depth analysis detailing your home's value as well as a comparison with similar homes in the area
Home Values in the Area
Average Home Value in this Area
Purchase History
| Date | Buyer | Sale Price | Title Company |
|---|---|---|---|
| Widney Kimberly M | $175,000 | None Available | |
| Snyder Lonnie A | $130,000 | -- | |
| Snyder Lonnie A | -- | -- |
Source: Public Records
Mortgage History
| Date | Status | Borrower | Loan Amount |
|---|---|---|---|
| Open | Widney Kimberly M | $166,250 | |
| Previous Owner | Snyder Lonnie A | $90,000 |
Source: Public Records
Tax History Compared to Growth
Tax History
| Year | Tax Paid | Tax Assessment Tax Assessment Total Assessment is a certain percentage of the fair market value that is determined by local assessors to be the total taxable value of land and additions on the property. | Land | Improvement |
|---|---|---|---|---|
| 2024 | $2,719 | $68,710 | $9,590 | $59,120 |
| 2023 | $2,719 | $68,710 | $9,590 | $59,120 |
| 2022 | $2,827 | $55,270 | $7,980 | $47,290 |
| 2021 | $2,873 | $55,270 | $7,980 | $47,290 |
| 2020 | $2,896 | $55,270 | $7,980 | $47,290 |
| 2019 | $2,416 | $48,090 | $7,770 | $40,320 |
| 2018 | $2,334 | $48,090 | $7,770 | $40,320 |
| 2017 | $2,303 | $48,090 | $7,770 | $40,320 |
| 2016 | $2,271 | $44,420 | $7,770 | $36,650 |
| 2015 | $2,165 | $44,420 | $7,770 | $36,650 |
| 2014 | $2,161 | $44,420 | $7,770 | $36,650 |
| 2013 | $2,730 | $55,100 | $8,440 | $46,660 |
Source: Public Records
Map
Nearby Homes
- 518 Providence St
- 421 Providence St
- 701 Palmwood St
- 207 Wood St
- 305 Mckinley St
- 308 Monroe St
- 703 Linwood Ave
- 201 Elmwood Ave
- 908 Fernwood St
- 413 Fernwood St
- 810 Greenview Ave
- 4329 County Road 1 #2
- 3121 County Road Ef
- 1797 County Road 5
- 6854 County Road 3
- 2121 County Road 4
- 2872 County Road 11
- 2511 County Road D
- 2076 County Rd E
- 7373 County Road 12
- 5609 Ohio 109
- 5647 State Route 109
- 5565 State Route 109
- 5652 State Route 109
- 5610 State Route 109
- 5570 State Route 109
- 5684 State Route 109
- 5684 Ohio 109
- 5525 State Route 109
- 5723 State Route 109
- 5720 State Route 109
- 5834 State Route 109
- 0 Sh 109 State Hwy
- 6793 County Road Ef
- 0 Co Road Ef County Rd Unit 6003078
- 6031 State Route 109
- 6072 State Route 109
- 6112 State Route 109
- 6138 State Route 109
- 7228 County Road E