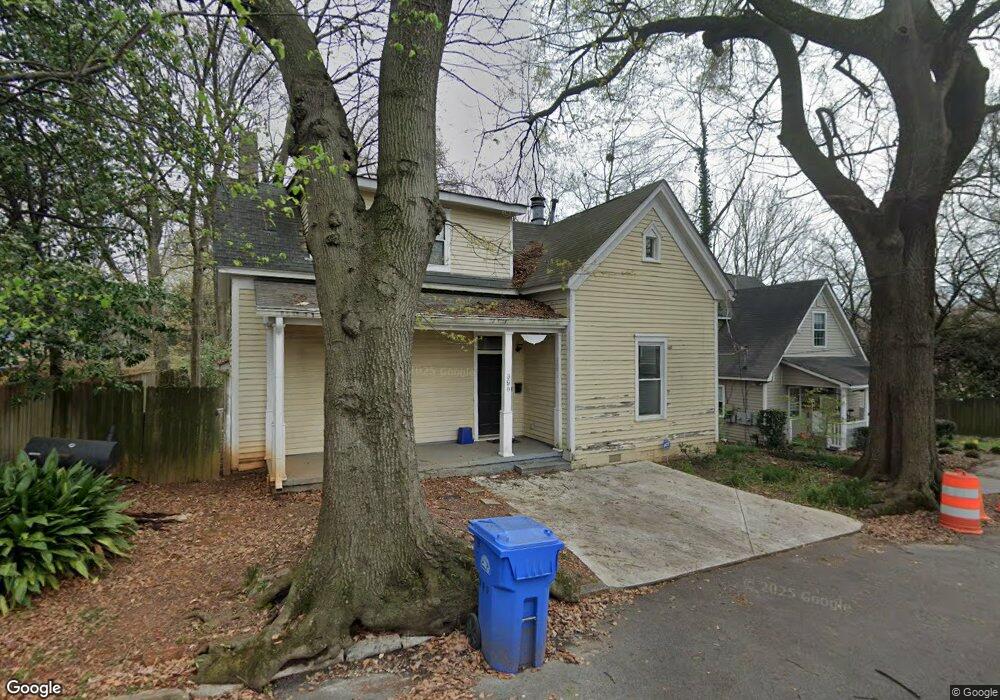
561 Formwa SW Unit 4 Atlanta, GA 30312
Mechanicsville NeighborhoodEstimated Value: $128,000 - $141,166
1
Bed
1
Bath
620
Sq Ft
$216/Sq Ft
Est. Value
About This Home
This home is located at 561 Formwa SW Unit 4, Atlanta, GA 30312 and is currently estimated at $133,792, approximately $215 per square foot. 561 Formwa SW Unit 4 is a home located in Fulton County with nearby schools including Dunbar Elementary School, King Middle School, and Maynard Holbrook Jackson High School.
Ownership History
Date
Name
Owned For
Owner Type
Purchase Details
Closed on
Dec 23, 2016
Sold by
My Lan
Bought by
Ginger Ridge Behavioral Heal
Current Estimated Value
Purchase Details
Closed on
May 17, 2016
Sold by
Pham Lilly Ann
Bought by
Nguyen Lan My
Purchase Details
Closed on
Jun 18, 2015
Sold by
Re Formwalt St Llc
Bought by
Pham Lilly Ann
Purchase Details
Closed on
Jun 30, 2014
Sold by
Vernex-Loset Hannah
Bought by
Re Formwalt St Llc
Purchase Details
Closed on
Jan 6, 2012
Sold by
Federal National Mortgage Association
Bought by
Vernex-Loset Hannah
Purchase Details
Closed on
Sep 6, 2011
Sold by
Wells Fargo Bank Na
Bought by
Federal National Mtg Associati
Purchase Details
Closed on
Dec 22, 2005
Sold by
Formwalt Court Llc
Bought by
Smith Robert
Home Financials for this Owner
Home Financials are based on the most recent Mortgage that was taken out on this home.
Original Mortgage
$93,120
Interest Rate
7.09%
Mortgage Type
New Conventional
Create a Home Valuation Report for This Property
The Home Valuation Report is an in-depth analysis detailing your home's value as well as a comparison with similar homes in the area
Home Values in the Area
Average Home Value in this Area
Purchase History
| Date | Buyer | Sale Price | Title Company |
|---|---|---|---|
| Ginger Ridge Behavioral Heal | $70,000 | -- | |
| Nguyen Lan My | -- | -- | |
| Pham Lilly Ann | $45,000 | -- | |
| Re Formwalt St Llc | -- | -- | |
| Vernex-Loset Hannah | $25,500 | -- | |
| Federal National Mtg Associati | $19,750 | -- | |
| Wells Fargo Bank Na | $19,750 | -- | |
| Smith Robert | $116,400 | -- |
Source: Public Records
Mortgage History
| Date | Status | Borrower | Loan Amount |
|---|---|---|---|
| Previous Owner | Smith Robert | $93,120 |
Source: Public Records
Tax History Compared to Growth
Tax History
| Year | Tax Paid | Tax Assessment Tax Assessment Total Assessment is a certain percentage of the fair market value that is determined by local assessors to be the total taxable value of land and additions on the property. | Land | Improvement |
|---|---|---|---|---|
| 2025 | $1,993 | $54,560 | $7,080 | $47,480 |
| 2023 | $2,587 | $62,480 | $8,120 | $54,360 |
| 2022 | $1,561 | $38,560 | $5,000 | $33,560 |
| 2021 | $1,517 | $37,440 | $4,840 | $32,600 |
| 2020 | $1,516 | $37,000 | $4,800 | $32,200 |
| 2019 | $117 | $34,000 | $4,400 | $29,600 |
| 2018 | $980 | $23,680 | $3,200 | $20,480 |
| 2017 | $777 | $18,000 | $3,120 | $14,880 |
| 2016 | $779 | $18,000 | $3,120 | $14,880 |
| 2015 | $458 | $9,680 | $1,680 | $8,000 |
| 2014 | -- | $9,680 | $1,680 | $8,000 |
Source: Public Records
Map
Nearby Homes
- 561 Formwalt St SW Unit 5
- 561 Formwalt St SW Unit 8
- 225 Crumley St SW
- 634 Cooper St SW
- 272 Glenn St SW
- 567 Cooper St SW
- 581 Cooper St SW
- 522 Pryor St SW
- 293 Glenn St SW
- 582 Windsor St SW
- 277 Ralph David Abernathy Blvd SW
- 502 Pryor St SW Unit 113
- 502 Pryor St SW Unit 125
- 502 Pryor St SW Unit 223
- 0 Pryor St SW
- 449 Formwalt St SW
- 450 Central Ave SW
- 665 Windsor St SW
- 670 Garibaldi St SW
- 585 Ira St SW
- 562 Formwalt St SW Unit 1
- 562 Formwalt St SW Unit 4
- 562 Formwalt St SW Unit 6
- 562 Formwalt St SW Unit 3
- 562 Formwalt St SW Unit 2
- 562 Formwalt St SW Unit 5
- 562 Formwalt St SW
- 568 Formwalt St SW
- 561 Formwalt St SW Unit Cozy 2br 1 bath near
- 571 Formwalt St SW
- 561 Formwalt St SW
- 571 Formwalt St SW Unit 12
- 571 Formwalt St SW Unit 11
- 571 Formwalt St SW Unit 10
- 571 Formwalt St SW Unit 9
- 571 Formwalt St SW Unit 8
- 571 Formwalt St SW Unit 7
- 571 Formwalt St SW Unit 6
- 571 Formwalt St SW Unit 5
- 571 Formwalt St SW Unit 4