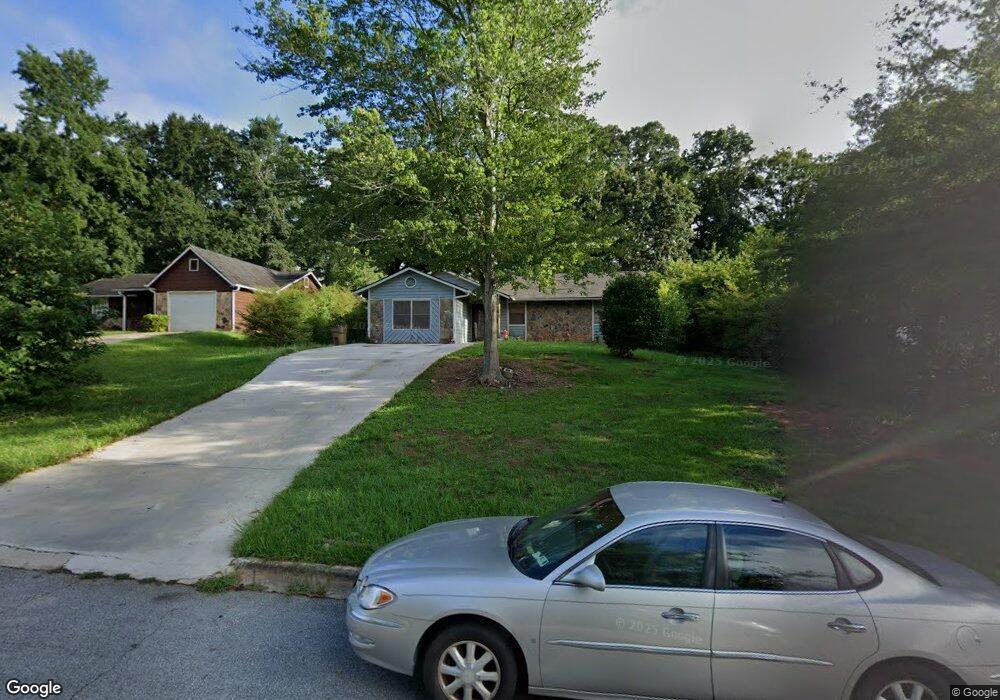
561 Hamlin Trace Riverdale, GA 30274
Estimated Value: $203,000 - $269,000
3
Beds
2
Baths
1,484
Sq Ft
$154/Sq Ft
Est. Value
About This Home
This home is located at 561 Hamlin Trace, Riverdale, GA 30274 and is currently estimated at $229,133, approximately $154 per square foot. 561 Hamlin Trace is a home located in Clayton County with nearby schools including Pointe South Elementary School, Pointe South Middle School, and Riverdale High School.
Ownership History
Date
Name
Owned For
Owner Type
Purchase Details
Closed on
Aug 16, 2018
Sold by
Stafford Kiana C
Bought by
Stafford Kiana C and Stafford Cyrus G
Current Estimated Value
Home Financials for this Owner
Home Financials are based on the most recent Mortgage that was taken out on this home.
Original Mortgage
$93,610
Outstanding Balance
$81,296
Interest Rate
4.5%
Mortgage Type
New Conventional
Estimated Equity
$147,837
Purchase Details
Closed on
Jun 22, 2018
Sold by
Deutsche Bank National Trust Co Trustee
Bought by
Atlanta Investor Grp Lp
Home Financials for this Owner
Home Financials are based on the most recent Mortgage that was taken out on this home.
Original Mortgage
$93,610
Outstanding Balance
$81,296
Interest Rate
4.5%
Mortgage Type
New Conventional
Estimated Equity
$147,837
Purchase Details
Closed on
Apr 3, 2018
Sold by
Mugweru James S
Bought by
Deutsche Bank National Trust C and C/O Ocwen Land Servicing Llc
Create a Home Valuation Report for This Property
The Home Valuation Report is an in-depth analysis detailing your home's value as well as a comparison with similar homes in the area
Home Values in the Area
Average Home Value in this Area
Purchase History
| Date | Buyer | Sale Price | Title Company |
|---|---|---|---|
| Stafford Kiana C | -- | -- | |
| Stafford Kiana C | $92,000 | -- | |
| Atlanta Investor Grp Lp | $56,912 | -- | |
| Deutsche Bank National Trust C | $81,000 | -- |
Source: Public Records
Mortgage History
| Date | Status | Borrower | Loan Amount |
|---|---|---|---|
| Open | Stafford Kiana C | $93,610 | |
| Closed | Stafford Kiana C | $93,610 |
Source: Public Records
Tax History Compared to Growth
Tax History
| Year | Tax Paid | Tax Assessment Tax Assessment Total Assessment is a certain percentage of the fair market value that is determined by local assessors to be the total taxable value of land and additions on the property. | Land | Improvement |
|---|---|---|---|---|
| 2024 | $2,965 | $76,000 | $5,320 | $70,680 |
| 2023 | $2,477 | $93,680 | $6,400 | $87,280 |
| 2022 | $0 | $68,600 | $6,400 | $62,200 |
| 2021 | $369 | $54,480 | $6,400 | $48,080 |
| 2020 | $369 | $52,293 | $6,400 | $45,893 |
| 2019 | $369 | $36,800 | $4,800 | $32,000 |
| 2018 | $369 | $27,919 | $4,800 | $23,119 |
| 2017 | $323 | $24,942 | $4,800 | $20,142 |
| 2016 | $312 | $24,441 | $4,800 | $19,641 |
| 2015 | $282 | $0 | $0 | $0 |
| 2014 | $167 | $18,429 | $6,400 | $12,029 |
Source: Public Records
Map
Nearby Homes
- 8198 Winewood Ct
- 8119 Woodlake Dr
- 8220 Englewood Trail
- 8114 Woodlake Dr
- 0 E Lake Dr Unit 10569013
- 0 E Lake Dr Unit 7619551
- 8040 Creekstone Way
- 7978 Woodlake Dr
- 640 Maple Dr
- 530 Wexwood Dr Unit 1
- 826 Crescent Dr Unit 63
- 832 Crescent Dr Unit 60
- The Sussex Plan at Crescent Towns
- The Maddux II Plan at Crescent Towns
- The Carson Plan at Crescent Towns
- The Ellison II Plan at Crescent Towns
- The Norwood II Plan at Crescent Towns
- 0 Taylor Rd Unit 10093638
- 282 Park Ridge Ct
- 274 Park Ridge Ct
- 553 Hamlin Trace
- 567 Hamlin Trace
- 545 Hamlin Trace
- 575 Hamlin Trace
- 564 Hamlin Trace Unit 4
- 556 Hamlin Trace Unit 4
- 537 Hamlin Trace
- 574 Hamlin Trace
- 548 Hamlin Trace
- 540 Hamlin Trace
- 531 Hamlin Trace
- 8138 Winewood Way
- 8138 Winewood Way
- 8105 Winewood Way Unit 4
- 8113 Winewood Way
- 8146 Winewood Way
- 8154 Winewood Way
- 532 Hamlin Trace
- 8121 Winewood Way
- 523 Hamlin Trace