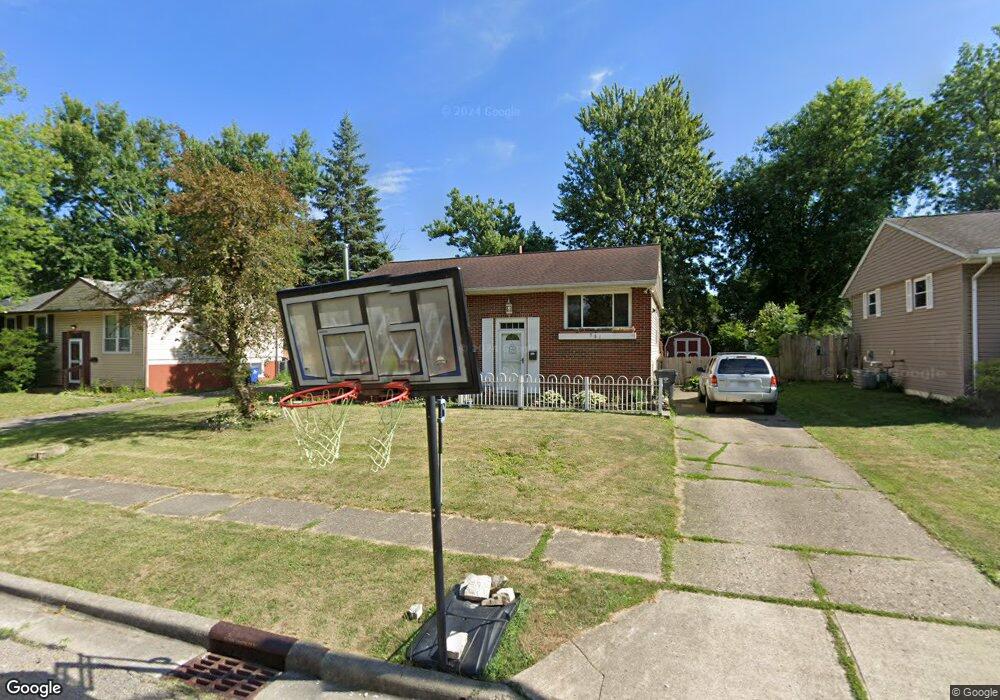
561 Knights Ave Columbus, OH 43230
Estimated Value: $262,280 - $288,000
4
Beds
2
Baths
1,655
Sq Ft
$168/Sq Ft
Est. Value
About This Home
This home is located at 561 Knights Ave, Columbus, OH 43230 and is currently estimated at $277,820, approximately $167 per square foot. 561 Knights Ave is a home located in Franklin County with nearby schools including Royal Manor Elementary School, Gahanna West Middle School, and Lincoln High School.
Ownership History
Date
Name
Owned For
Owner Type
Purchase Details
Closed on
Jun 8, 2007
Sold by
Jivanjee Brandie M and Jivanjee Jamal
Bought by
Denney Joshua P and Denney Jennifer M
Current Estimated Value
Home Financials for this Owner
Home Financials are based on the most recent Mortgage that was taken out on this home.
Original Mortgage
$134,900
Outstanding Balance
$80,979
Interest Rate
6.2%
Mortgage Type
Purchase Money Mortgage
Estimated Equity
$196,841
Purchase Details
Closed on
Jun 6, 2003
Sold by
Southard Carol J and Southard Stephen J
Bought by
Jivanjee Brandie M
Home Financials for this Owner
Home Financials are based on the most recent Mortgage that was taken out on this home.
Original Mortgage
$121,153
Interest Rate
5.71%
Mortgage Type
Purchase Money Mortgage
Purchase Details
Closed on
Apr 26, 1995
Sold by
Tucker Larry W
Bought by
Al Carol J Southard and Al Stephen J Southa
Create a Home Valuation Report for This Property
The Home Valuation Report is an in-depth analysis detailing your home's value as well as a comparison with similar homes in the area
Purchase History
| Date | Buyer | Sale Price | Title Company |
|---|---|---|---|
| Denney Joshua P | $134,900 | Landam-Lawyers East | |
| Jivanjee Brandie M | $124,900 | -- | |
| Al Carol J Southard | $67,500 | -- |
Source: Public Records
Mortgage History
| Date | Status | Borrower | Loan Amount |
|---|---|---|---|
| Open | Denney Joshua P | $134,900 | |
| Closed | Jivanjee Brandie M | $121,153 |
Source: Public Records
Tax History
| Year | Tax Paid | Tax Assessment Tax Assessment Total Assessment is a certain percentage of the fair market value that is determined by local assessors to be the total taxable value of land and additions on the property. | Land | Improvement |
|---|---|---|---|---|
| 2025 | $4,543 | $77,110 | $22,720 | $54,390 |
| 2024 | $4,543 | $77,110 | $22,720 | $54,390 |
| 2023 | $4,486 | $77,105 | $22,715 | $54,390 |
| 2022 | $3,842 | $51,450 | $12,250 | $39,200 |
| 2021 | $3,716 | $51,450 | $12,250 | $39,200 |
| 2020 | $3,685 | $51,450 | $12,250 | $39,200 |
| 2019 | $3,050 | $42,500 | $10,190 | $32,310 |
| 2018 | $3,041 | $42,500 | $10,190 | $32,310 |
| 2017 | $2,925 | $42,500 | $10,190 | $32,310 |
| 2016 | $3,051 | $42,180 | $9,030 | $33,150 |
| 2015 | $3,053 | $42,180 | $9,030 | $33,150 |
| 2014 | $3,030 | $42,180 | $9,030 | $33,150 |
| 2013 | $1,504 | $42,175 | $9,030 | $33,145 |
Source: Public Records
Map
Nearby Homes
- 278 Empire Dr
- 643 Bonnington Way
- 209 Prince of Wales Dr
- 221 Lincolnshire Rd
- 600 Agler Rd
- 309 Baroness Way
- 388 Elkwood Place
- 595 Deerwood Ave E
- 420 Denwood Ct
- 395 Amesbury Dr
- 2655 Aeden Dr
- 4083 MacAldus Dr
- 475 Denwood Ct
- 0 E Armuth Ave
- 2225 Mifflin Blvd
- 4125 Emerius Dr
- 464 Foxwood Dr
- 0 E Minnesota Ave Unit 224018641
- 377 Highbury Crescent
- 299 Sherwood Meadows Dr
- 555 Knights Ave
- 567 Knights Ave
- 549 Knights Ave
- 573 Knights Ave
- 568 Fenchurch Way
- 574 Fenchurch Way
- 552 Fairholme Rd
- 562 Fenchurch Way
- 572 Knights Ave
- 579 Knights Ave
- 578 Fenchurch Way
- 550 Knights Ave
- 543 Knights Ave
- 558 Fenchurch Way
- 544 Knights Ave
- 584 Fenchurch Way
- 561 Fairholme Rd
- 585 Knights Ave
- 558 Fairholme Rd
- 181 Empire Dr
Your Personal Tour Guide
Ask me questions while you tour the home.