Estimated Value: $120,000 - $136,256
2
Beds
1
Bath
1,154
Sq Ft
$110/Sq Ft
Est. Value
About This Home
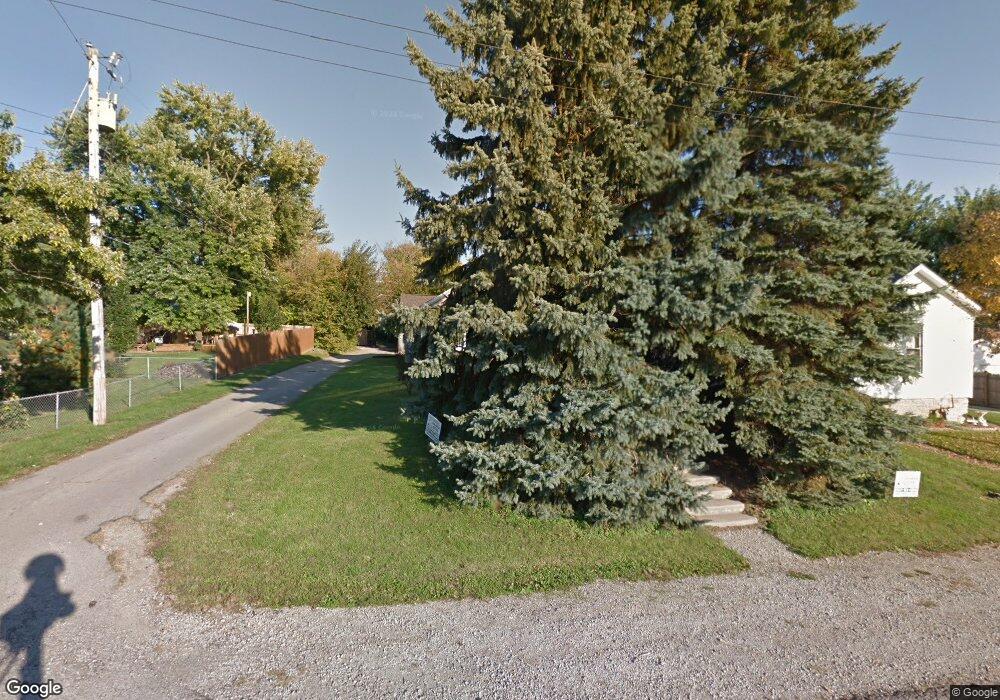
This home is located at 561 Lynn St, Xenia, OH 45385 and is currently estimated at $126,564, approximately $109 per square foot. 561 Lynn St is a home located in Greene County with nearby schools including Xenia High School, Summit Academy Community School for Alternative Learners - Xenia, and Legacy Christian Academy.
Ownership History
Date
Name
Owned For
Owner Type
Purchase Details
Closed on
May 15, 2018
Sold by
Keller Thomas J
Bought by
Keller Thomas J and Keller Sharon L
Current Estimated Value
Purchase Details
Closed on
Oct 8, 2004
Sold by
Bank One Na
Bought by
Keller Thomas J
Purchase Details
Closed on
Sep 30, 2004
Sold by
Lennon Cynthia A and Cross Clifford L
Bought by
Bank One Na
Create a Home Valuation Report for This Property
The Home Valuation Report is an in-depth analysis detailing your home's value as well as a comparison with similar homes in the area
Home Values in the Area
Average Home Value in this Area
Purchase History
| Date | Buyer | Sale Price | Title Company |
|---|---|---|---|
| Keller Thomas J | -- | None Available | |
| Keller Thomas J | $10,000 | -- | |
| Bank One Na | $28,000 | -- |
Source: Public Records
Tax History
| Year | Tax Paid | Tax Assessment Tax Assessment Total Assessment is a certain percentage of the fair market value that is determined by local assessors to be the total taxable value of land and additions on the property. | Land | Improvement |
|---|---|---|---|---|
| 2025 | $1,255 | $28,810 | $5,210 | $23,600 |
| 2024 | $1,255 | $28,810 | $5,210 | $23,600 |
| 2023 | $1,233 | $28,810 | $5,210 | $23,600 |
| 2022 | $1,098 | $21,880 | $4,170 | $17,710 |
| 2021 | $1,112 | $21,880 | $4,170 | $17,710 |
| 2020 | $1,066 | $21,880 | $4,170 | $17,710 |
| 2019 | $1,078 | $20,840 | $4,710 | $16,130 |
| 2018 | $1,083 | $20,840 | $4,710 | $16,130 |
| 2017 | $1,039 | $20,840 | $4,710 | $16,130 |
| 2016 | $1,040 | $19,640 | $4,710 | $14,930 |
| 2015 | $1,043 | $19,640 | $4,710 | $14,930 |
| 2014 | $998 | $19,640 | $4,710 | $14,930 |
Source: Public Records
Map
Nearby Homes
Your Personal Tour Guide
Ask me questions while you tour the home.