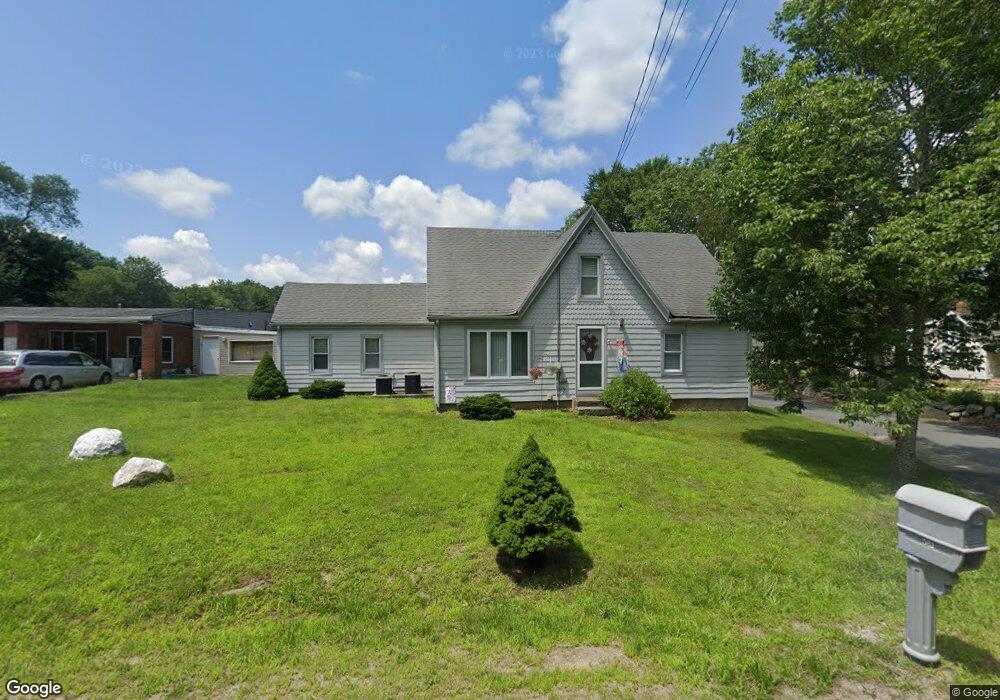
561 Main St Acushnet, MA 02743
Upper Acushnet Neighborhood
Studio
1
Bath
--
Sq Ft
96,268
Sq Ft Lot
About This Home
This home is located at 561 Main St, Acushnet, MA 02743. 561 Main St is a home located in Bristol County with nearby schools including Acushnet Elementary School, Albert F Ford Middle School, and Alma Del Mar Charter School.
Ownership History
Date
Name
Owned For
Owner Type
Purchase Details
Closed on
Jun 11, 2007
Sold by
Paim Re Corp Inc
Bought by
Paim Kevin M
Home Financials for this Owner
Home Financials are based on the most recent Mortgage that was taken out on this home.
Original Mortgage
$277,900
Outstanding Balance
$169,861
Interest Rate
6.17%
Mortgage Type
Commercial
Purchase Details
Closed on
Sep 14, 2006
Sold by
Paim Kevin
Bought by
Paim Re Corp Inc
Purchase Details
Closed on
Feb 23, 2005
Sold by
Sougnez Brian and Sougnez Jeffrey J
Bought by
Paim Kevin
Create a Home Valuation Report for This Property
The Home Valuation Report is an in-depth analysis detailing your home's value as well as a comparison with similar homes in the area
Home Values in the Area
Average Home Value in this Area
Purchase History
| Date | Buyer | Sale Price | Title Company |
|---|---|---|---|
| Paim Kevin M | -- | -- | |
| Paim Kevin M | -- | -- | |
| Paim Re Corp Inc | -- | -- | |
| Paim Re Corp Inc | -- | -- | |
| Paim Kevin | $185,000 | -- | |
| Paim Kevin | $185,000 | -- |
Source: Public Records
Mortgage History
| Date | Status | Borrower | Loan Amount |
|---|---|---|---|
| Closed | Paim Kevin | $0 | |
| Open | Paim Kevin | $277,900 | |
| Closed | Paim Kevin | $277,900 |
Source: Public Records
Tax History
| Year | Tax Paid | Tax Assessment Tax Assessment Total Assessment is a certain percentage of the fair market value that is determined by local assessors to be the total taxable value of land and additions on the property. | Land | Improvement |
|---|---|---|---|---|
| 2025 | $0 | $630,800 | $174,800 | $456,000 |
| 2024 | -- | $587,300 | $165,700 | $421,600 |
| 2023 | $3,576 | $535,900 | $150,300 | $385,600 |
| 2022 | $0 | $508,700 | $141,300 | $367,400 |
| 2021 | $0 | $471,800 | $141,300 | $330,500 |
| 2020 | $4,577 | $462,800 | $132,300 | $330,500 |
| 2019 | $0 | $434,100 | $126,300 | $307,800 |
| 2018 | -- | $374,800 | $126,300 | $248,500 |
| 2017 | -- | $367,000 | $126,300 | $240,700 |
| 2016 | -- | $351,600 | $126,300 | $225,300 |
| 2015 | $4,692 | $351,600 | $126,300 | $225,300 |
Source: Public Records
Map
Nearby Homes
- 489 Main St
- 363 Main St
- 0 Land Way Unit 73479153
- 25 Pershing Ave
- 23 Oliveira Ave
- 191 Hathaway Rd
- 329 Middle Rd
- 0 Hathaway Rd Unit 73469544
- 12 White St
- 7 Hamlin St
- 134 Nyes Ln
- 11 Boylston St
- 23 Coury Dr
- 14 Hayes St Unit 1
- 12 Hayes St Unit 1
- 27 Meadow Ln
- 1015 Forbes St
- ES Acushnet Ave
- 15 Ball St
- 40 Foley Dr
Your Personal Tour Guide
Ask me questions while you tour the home.