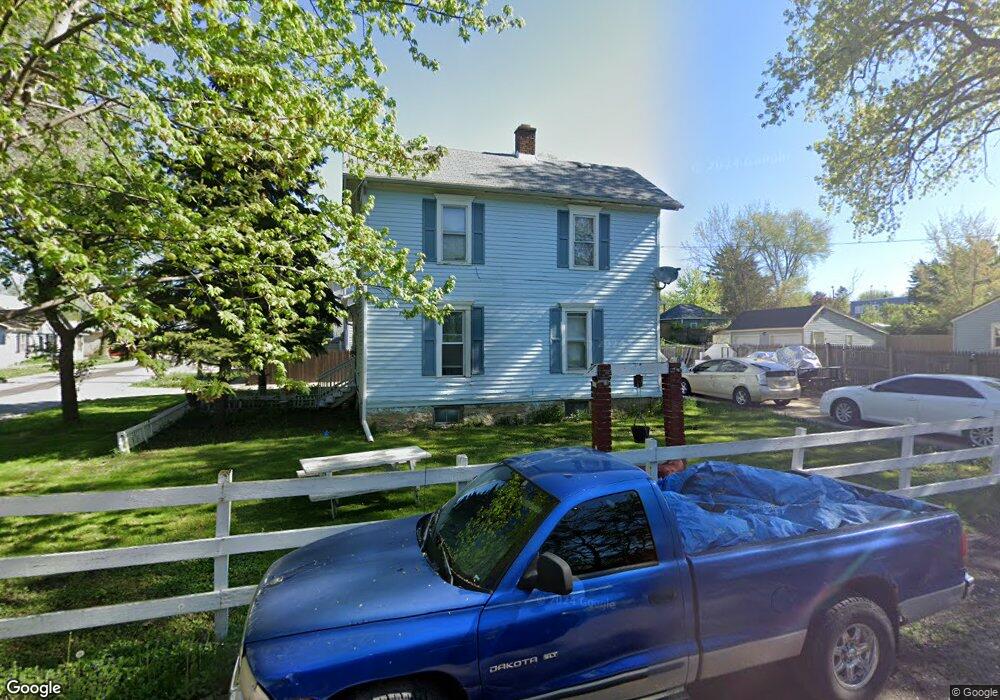
561 N Root St Aurora, IL 60505
Pigeon Hill NeighborhoodEstimated Value: $237,000 - $316,000
4
Beds
4
Baths
1,988
Sq Ft
$133/Sq Ft
Est. Value
About This Home
This home is located at 561 N Root St, Aurora, IL 60505 and is currently estimated at $265,178, approximately $133 per square foot. 561 N Root St is a home located in Kane County with nearby schools including Nicholas A Hermes Elementary School, Simmons Middle School, and East Aurora High School.
Ownership History
Date
Name
Owned For
Owner Type
Purchase Details
Closed on
Aug 19, 2009
Sold by
Covarrubias Maria B
Bought by
Covarrubias Alfonso
Current Estimated Value
Purchase Details
Closed on
Aug 1, 1997
Sold by
Heimsoth Mark E and Stadler Ralph K
Bought by
Covarrubias Alfonso and Covarrubias Maria B
Home Financials for this Owner
Home Financials are based on the most recent Mortgage that was taken out on this home.
Original Mortgage
$65,951
Interest Rate
7.68%
Mortgage Type
FHA
Create a Home Valuation Report for This Property
The Home Valuation Report is an in-depth analysis detailing your home's value as well as a comparison with similar homes in the area
Home Values in the Area
Average Home Value in this Area
Purchase History
| Date | Buyer | Sale Price | Title Company |
|---|---|---|---|
| Covarrubias Alfonso | -- | Ticor Title Insurance Co | |
| Covarrubias Alfonso | $44,000 | -- |
Source: Public Records
Mortgage History
| Date | Status | Borrower | Loan Amount |
|---|---|---|---|
| Closed | Covarrubias Alfonso | $65,951 |
Source: Public Records
Tax History
| Year | Tax Paid | Tax Assessment Tax Assessment Total Assessment is a certain percentage of the fair market value that is determined by local assessors to be the total taxable value of land and additions on the property. | Land | Improvement |
|---|---|---|---|---|
| 2024 | $4,481 | $65,371 | $7,668 | $57,703 |
| 2023 | $4,272 | $57,172 | $6,851 | $50,321 |
| 2022 | $3,963 | $52,164 | $6,251 | $45,913 |
| 2021 | $3,921 | $48,566 | $5,820 | $42,746 |
| 2020 | $3,752 | $45,111 | $5,406 | $39,705 |
| 2019 | $3,683 | $41,797 | $5,009 | $36,788 |
| 2018 | $3,489 | $38,206 | $4,633 | $33,573 |
| 2017 | $3,368 | $34,343 | $4,269 | $30,074 |
| 2016 | $3,478 | $33,052 | $3,074 | $29,978 |
| 2015 | -- | $29,570 | $2,643 | $26,927 |
| 2014 | -- | $28,327 | $2,429 | $25,898 |
| 2013 | -- | $30,363 | $2,321 | $28,042 |
Source: Public Records
Map
Nearby Homes
- 608 Front St
- 747 Delius St
- 461 Wood St
- 773 Aurora Ave
- 971 Solfisburg Ave
- 231-233 Williams St
- 304 Hankes Ave
- 1009 Assell Ave
- 14-18 N Lake St
- 1123 Front St
- 107 N State St
- 222 Grand Ave
- 357 W Park Ave
- 574 E Galena Blvd
- 371 Cedar St
- 20-22 N Locust St
- 1220 Mitchell Rd
- 907 Harley Ct
- 359 W Galena Blvd
- 418 W Illinois Ave
Your Personal Tour Guide
Ask me questions while you tour the home.